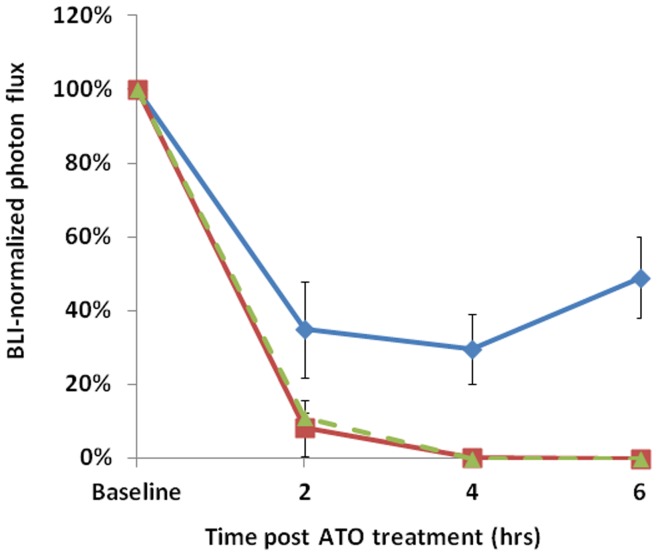
Figure 5. Comparative vascular shutdown following ATO (8 mg/kg) to mice bearing various tumors.
Relative BLI signal intensity observed for tumors 10 mins after administration of luciferin with respect to drug treatment in three different types: blue ♦ MCF7-mCherry-luc; green ▴U87-mCherry-luc; red ▪ PC3-luc; mean values ± SE.

