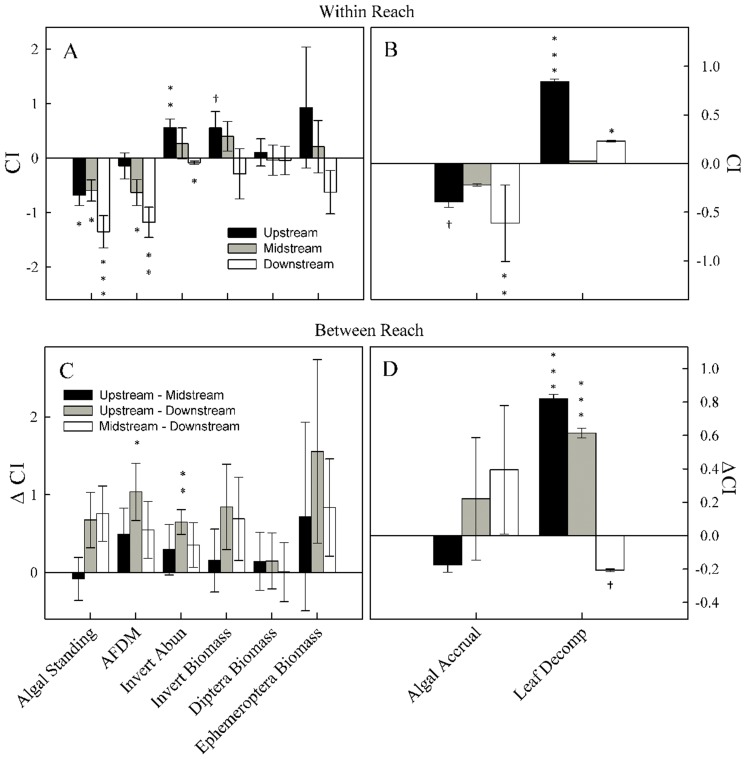
Figure 2. Consumer Impacts (CI) for each reach (Within) and the differences (ΔCI) between reaches (Between).
All CI values are calculated from planned comparisons from linear models except slope estimates, which were calculated from the predicted slopes from the fixed and random effects models (see text). Positive values indicate increase in response variable with consumers, whereas negative values indicate a decrease. Each bar is the mean (±1 SE) of 5 replicates. All significance values are from planned contrasts from linear model with ***P<0.001, **P<0.01, *P<0.05, †P<0.10.

