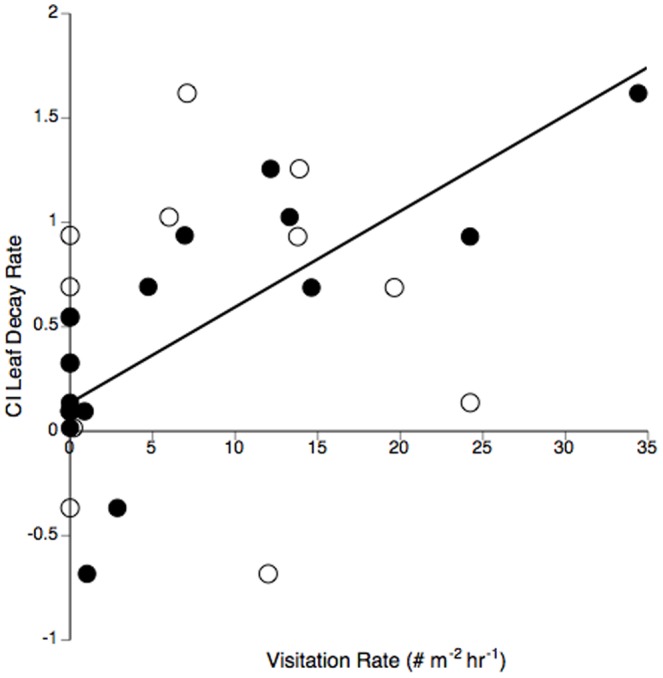
Figure 3. Consumer Impact (CI) of leaf decay rate plotted against visitation rate across all study reaches.

Killifish plotted as solid symbols. Crabs plotted as hollow symbols. Line is a linear fit (P<.001, r2 = .59) for killifish. The relationship for crabs was not significant. Positive CI values indicate increase in response variable with large consumers present, whereas negative values indicate a decrease.
