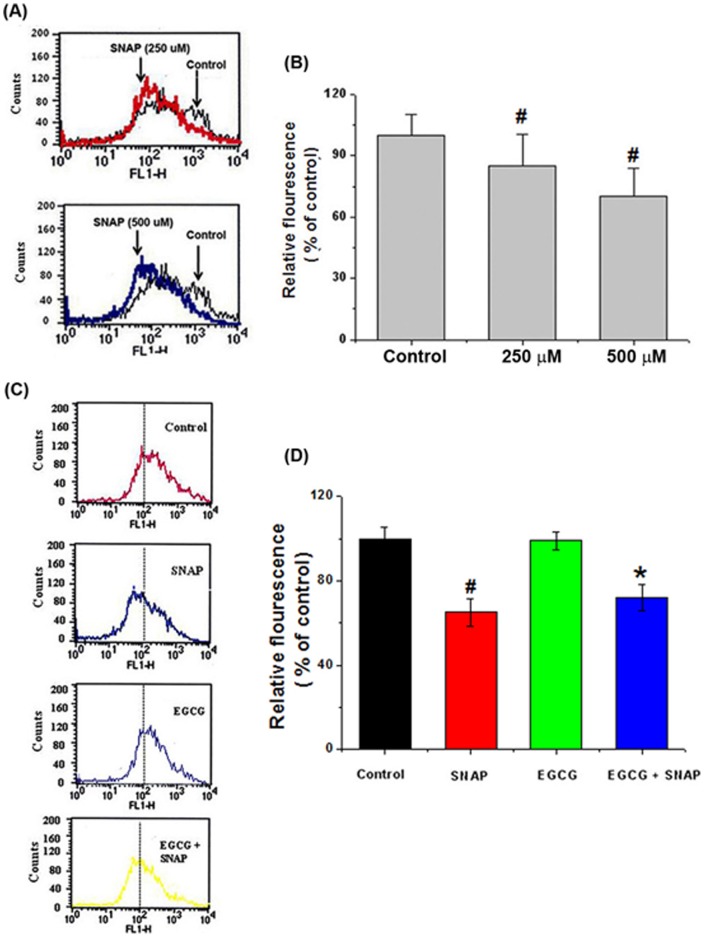
Figure 3. Effects of EGCG on NO-induced MMP loss in HEI-OC1 cells.
(A) MMP levels were measured by flow cytometry using the fluorescent probe DiOC6. SNAP incubation (250–500 μM) resulted in a left shift of the cell distribution, indicating reduced MMP. (B) The mean fluorescence intensity of the traces is depicted in panel A. (C) Cells were pretreated with 50 μM EGCG, followed by treatment with 500 μM SNAP for 24 h. MMP levels were measured by flow cytometry. (D) The mean fluorescence intensity of the traces is depicted in panel C. All data represent the mean ± SEM of 3 independent experiments (#P<0.05 vs. control, *P<0.05 vs. SNAP alone).

