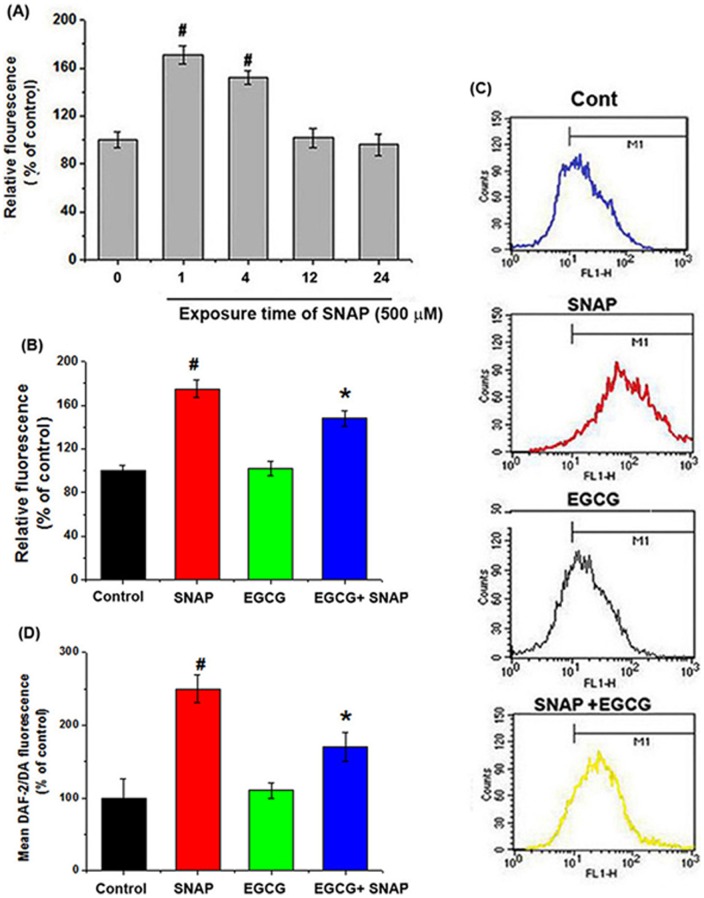
Figure 4. Effects of EGCG on NO-induced ROS production in HEI-OC1 cells.
(A) ROS levels were measured using the fluorescent probe DCFH-DA and a spectrofluorometer. Cells were treated with 500 μM SNAP for varying times. (B) Cells were pretreated with 50 μM EGCG, followed by treatment with 500 μM SNAP for 1 h. The relative fluorescence levels were measured. (C) ROS production was measured by flow cytometry analysis. (D) The relative fluorescence levels of DAF-2/DA were measured. All data represent the mean ± SEM of 3 independent experiments (#P<0.05 vs. control, *P<0.05 vs. SNAP alone).

