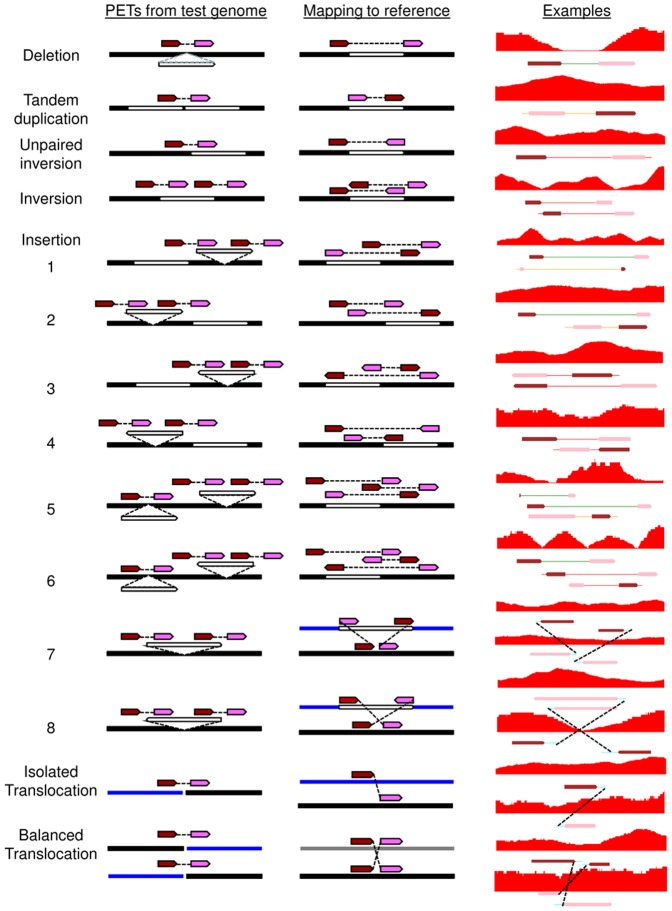
Figure 3. SV identification based on the mapping pattern of dPET clusters.
The dark red and pink arrows represent the 5′ and 3′ anchor regions of the dPET cluster, respectively. Black, white and blue horizontal lines represent chromosome segments. The red track represents the coverage of cPETs. The dotted lines indicate the connections between the two dPET clusters. The sub-types of insertions are as follows: (1) Intra-chromosomal direct forward insertion. (2) Intra-chromosomal direct backward insertion. (3) Intra-chromosomal inverted forward insertion. (4) Intra-chromosomal inverted backward insertion. (5) Deletion plus intra-chromosomal direct forward insertion. (6) Deletion plus intra-chromosomal inverted forward insertion. (7) Inter-chromosomal direct insertion. (8) Inter chromosome inverted insertion.

