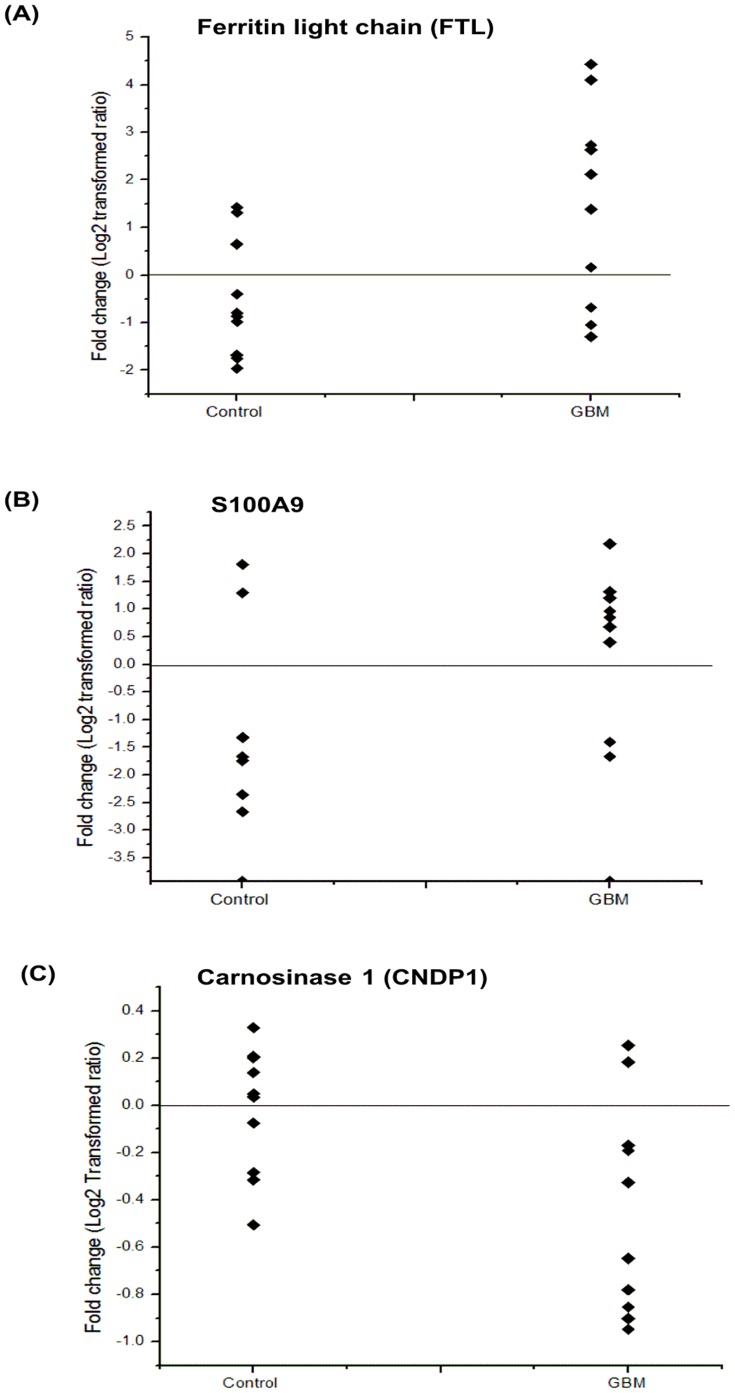
Figure 5. Scatter plot representing altered levels of ferritin light chain, S100A9 and carnosinase 1, in individual specimens from control subjects and GBM patients as determined by ELISA.
Elevated levels of Ferritin light chain were observed in 7 out of 10 GBM cases and in 8 out of 10 patients for S100A9. Lower levels of Carnosinase 1were observed in 8 out of 10 GBM patients. The fold changes are shown in log2 transformed ratio. The details of ELISA are given under Methods.

