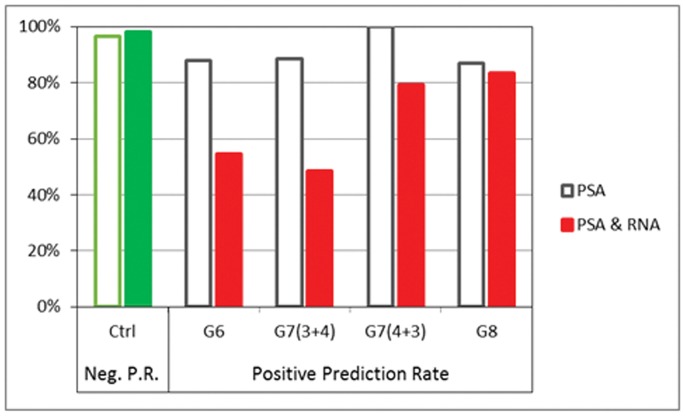
Figure 3. Predictions for independent Cohort III and Cohort IV samples.
The negative prediction rate for control cases is charted along with the positive prediction rates for cancer cases. PSA alone has high positive predictive rates for all cancer grades (>87%) but the combined PSA and RNA panel has lower positive prediction rates for the less aggressive G6 and G7(3+4) subgroups, 55%, and 49% respectively) while nearly the same positive prediction rate for the more aggressive G7(4+3) as G8 groups (79% and 83% respectively.

