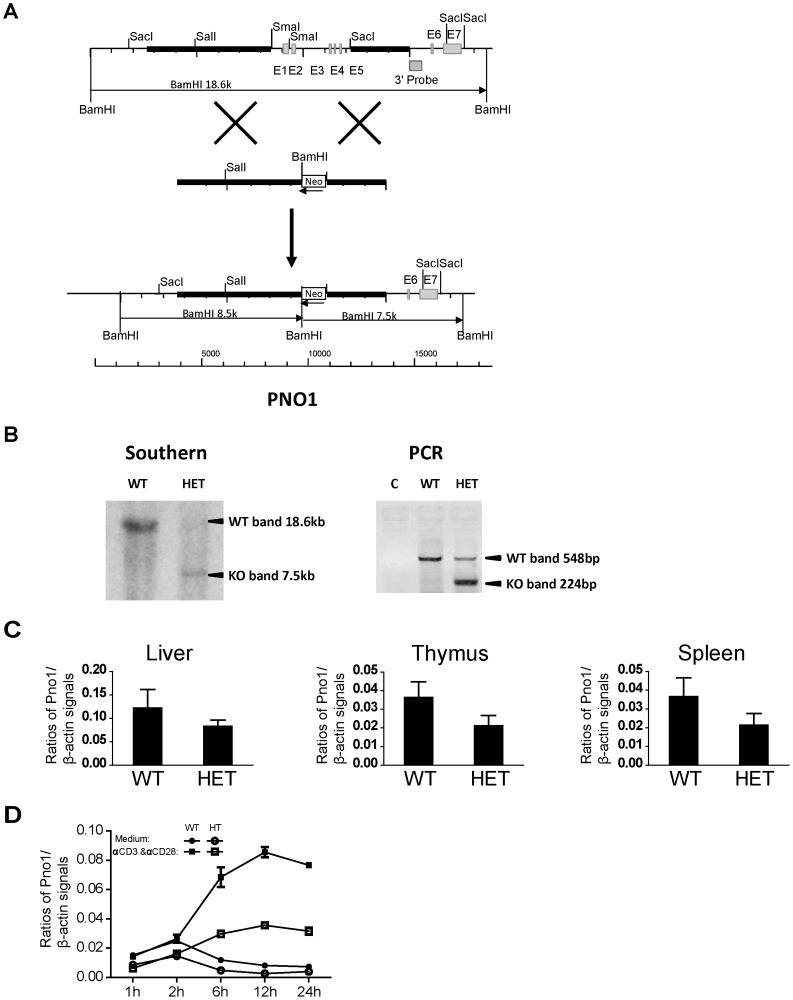
Figure 3. Generation of Pno1 KO mice.
A. Targeting strategy to generate Pno1 KO mice. The black square marked as 3′ probe represents the sequence used as probe in Southern blotting for genotyping. A 18.6-kb BamH1 fragment detected by this probe represents the WT allele, and a 7.5-kb BamH1 fragment, the KO allele. B. Genotyping of Pno1 mutant mice . Tail DNA was digested with BamHI, and analyzed by Southern blotting (left panel), with a 3′ probe whose sequence location is indicated in A. A 18.6-kb band representing the WT allele and a 7.5-kb band representing the recombinant allele are indicated by arrows. Ear lobe DNA without digestion was analyzed by PCR for routine genotyping (right panel). A 548-bp band representing the WT allele and a 224-bp band representing the recombinant allele are indicated by arrows. C. Reduced Pno1 mRNA expression in Pno1+/− tissues. mRNA from the Li, Th and Spl of WT and heterozygous Pno1+/− (HET) mice were analyzed by reverse transcription-real time PCR (RT-qPCR) for Pno1 mRNA levels. The results are expressed as ratios of Pno1 versus β-actin signals with means ± SD indicated. D. Reduced Pno1 mRNA up-regulation in Pno1+/− T cells upon activation. T cells from WT and HET Spl were stimulated with solid phase anti-CD3 mAb and anti-CD28 mAb (0.5 µg/ml and 4 µg/ml respectively for coating) for 1 to 24 h, and their Pno1 mRNA levels were quantified by RT-qPCR. The results are expressed as ratios of Pno1 versus β-actin signals with means ± SD indicated.

