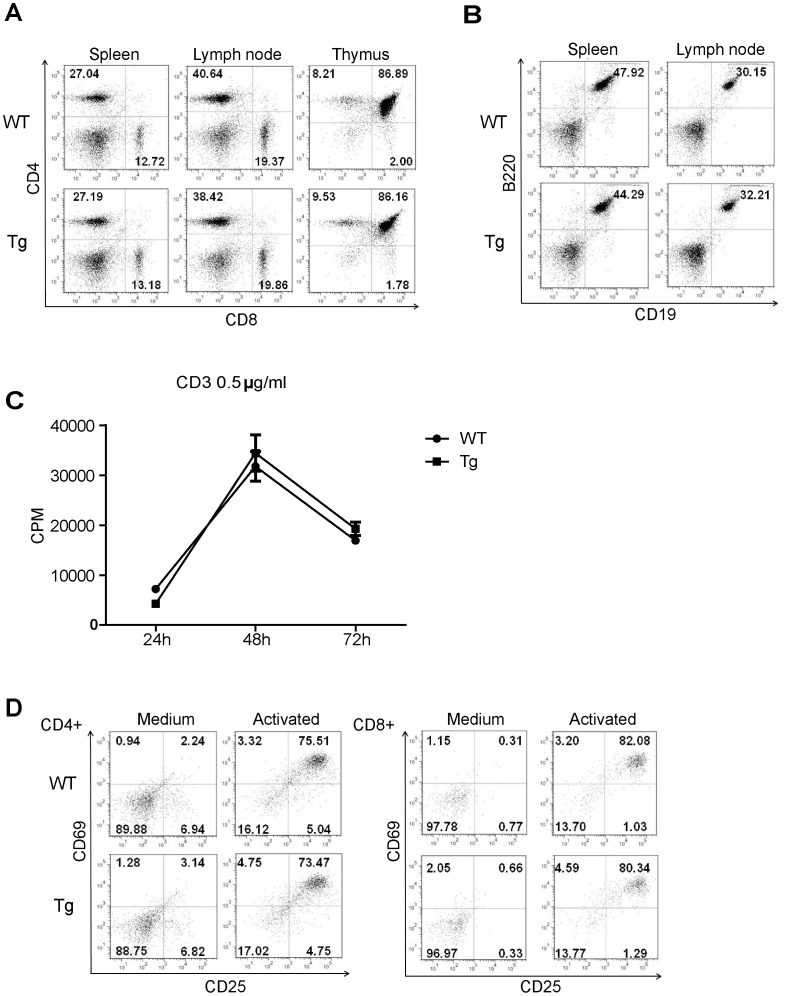
Figure 9. Sub-populations of lymphocytes in lymphoid organs and T cell function of Pno1 Tg mice.
A. T cell sub-populations in the spleen and LN. CD4 and CD8 T cell populations in the WT and Tg spleen LN and thymus were analyzed by 2-color flow cytometry. Percentages are indicated. B. B cell population in lymphoid organs. The B cell population in the spleen and LN was analyzed according to B220 and CD19 expression by 2-color flow cytometry. C. T cell proliferation. WT and Tg spleen T cells were stimulated with solid phase anti-CD3 mAb (0.5 µg/ml for coating). The cells were pulsed with 3H-thymidine 16 h before harvesting. 3H-thymidine uptake by cells was measured at 24, 48 and 72 h. The samples were tested in triplicate, and means ± SD of CPM are shown. D. C69 and CD25 expression on activated WT and HET T cells.WT and Tg T cells were stimulated overnight by solid phase anti-CD3 plus anti-CD28 mAbs (0.5 µg/ml and 4 µg/ml respectively for coating). CD69 and CD25 expression on CD4 (left panel) and CD8 (right panel) T cells was measured by 2-color flow cytometry. All experiments in this figure were repeated at least 3 times and representative data are shown.

