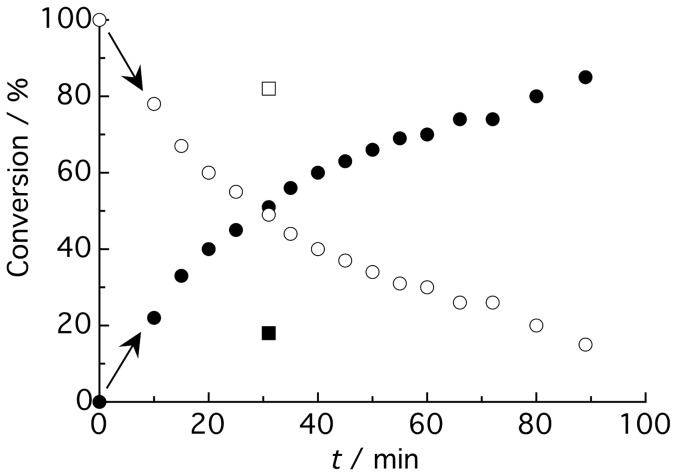
Figure 3. Kinetic monitoring of ADC activity carried out using 1 mM L-aspartate and 3 µM enzyme.
The different points correspond to conversion percentages of the individual 1H NMR spectra taken at increasing reaction times after initiation of the reaction in D2O at 25°C. Percentage of product formation and substrate depletion is represented by filled and empty circles, respectively. The percentage of product and substrate after 30 min of the reaction in the presence of D-tartrate is represented by filled and empty squares, respectively.

