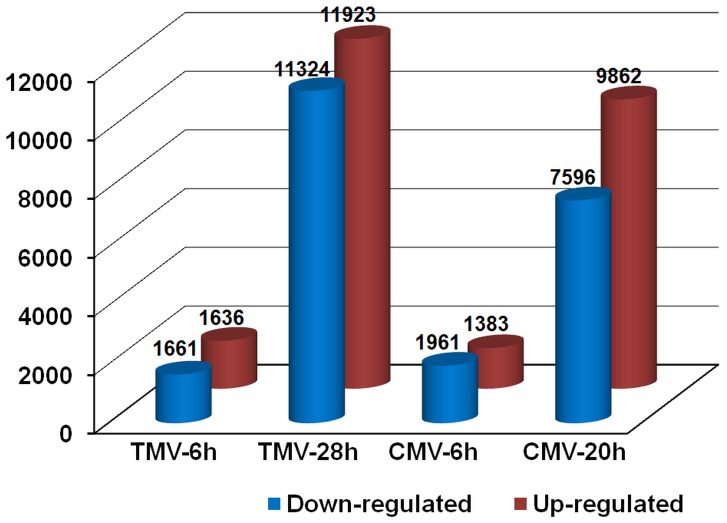
Figure 6. Changes in gene expression profiles of the TMV- and CMV-inoculated C. amaranticolor leaves at two different time points post-inoculation.
The comparisons were made between inoculated and uninoculated (healthy leaves) at each time point. The numbers of up-regulated and down-regulated genes are summarized.

