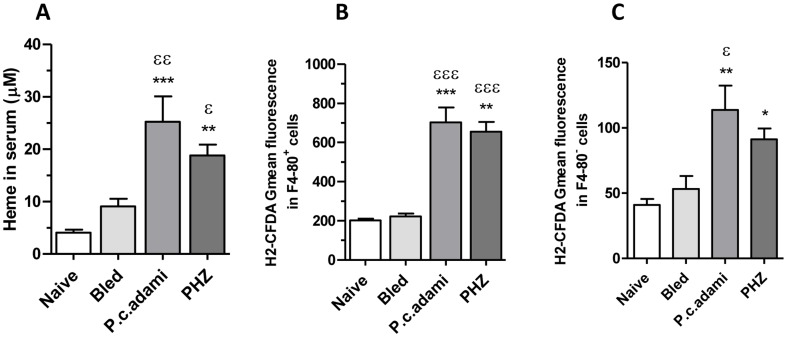
Figure 5. Reactive oxygen species in the bone marrow and serum heme levels.
Naive, bled, P.c. adami-infected and PHZ-treated female BALB/c mice (4–6 weeks old) were euthanized. (A) Serum levels of heme were assessed as described in Material and Methods. (B) Bone marrow cells were recovered from the tibia by flushing and cell aliquots were stained with anti-F4-80 biotin/strepatavidin PERCP and then labelled with 2′,7′ dichlorodihydrofluorescein diacetate (H2-DCFDA). The mean cellular fluorescence was measured and analyzed in F4-80+ cells (B) and F4-80− cells (C) in a FACScan cytofluorometer. Results are mean ± SEM from 4 mice per group and are compared using a one–way ANOVA and Tukey's multiple test. *P<0.05, **P<0.01 and ***P<0.001 are comparisons to naive; εP<0.05, εεP<0.01 and εεεP<0.001 are comparisons to bled mice.

