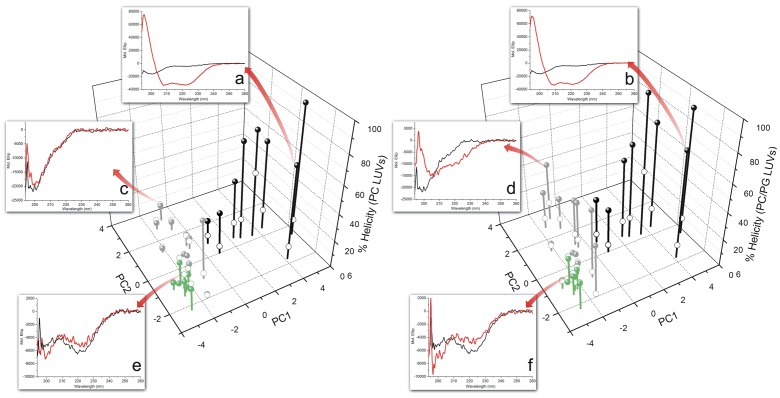
Figure 4. The helicity of peptides in buffer and at 1 mol% DMPC or 2∶1 DMPC:DMPG LUVs are correlated to peptides spatial location in the first two principal components derived from DSC data.
Far-UV CD spectra of selected cases for each of the three peptide clusters are shown. Insets (a), (c) and (e) depict the far-UV CD spectra for HSP-4, penetratin and the IAP Q8RW88(70–95), respectively, in buffer (hollow spheres) and titrated with DMPC LUVs (filled spheres). Insets (b), (d) and (f) demonstrate the CD spectra of the same peptides in buffer and added with 2∶1 DMPC:DMPG LUVs. MREs were similar for 0.01 and 0.005 peptide/phospholipids molar ratios, indicating that secondary structure changes reached a plateau under these conditions.

