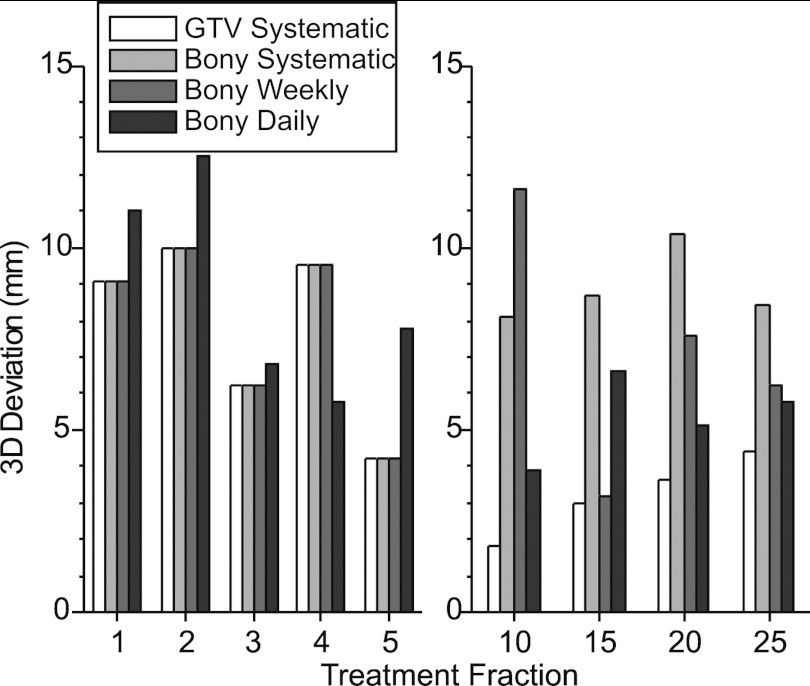
Figure 5.
Example (Patient 1) of 3D deviations in GTV position on treatment fractions in which an RC-CBCT scan was acquired. Data labeled “GTV systematic” are the actual measurements resulting from the RC-CBCT guided (Type 1) correction shown in Fig. 4, whereas data for the other correction methods are retrospectively simulated as described in the text.

