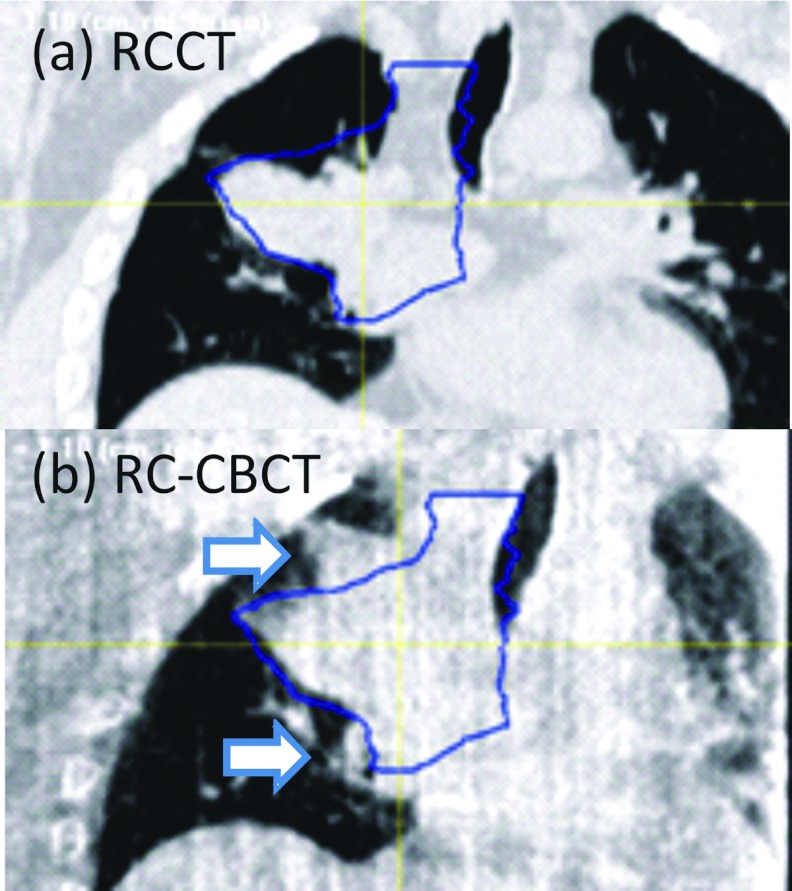
Figure 9.
Coronal section of Patient 1 in (a) the end-expiration respiration-correlated CT (RCCT) at simulation; (b) the end-expiration respiration-correlated cone-beam CT (RC-CBCT) at treatment 19 days later. Contours indicate the outline of the GTV drawn on the RCCT. Arrows in (b) indicate regions where the GTV in the cone-beam CT has grown outside the RCCT-defined GTV.

