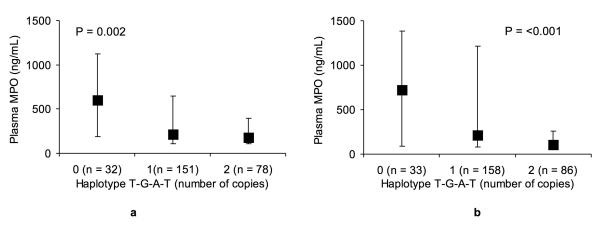
Figure 3. Plasma levels of myeloperoxidase (MPO) in the (3A) primary and (3B) secondary cohort stratified by the MPO haplotype T-G-A-T copy number (0, 1, 2 copies per diploid individual).
The data are represented as median (25th and 75th percentile) values. The P values are derived from by Wilcoxon signed-rank test.

