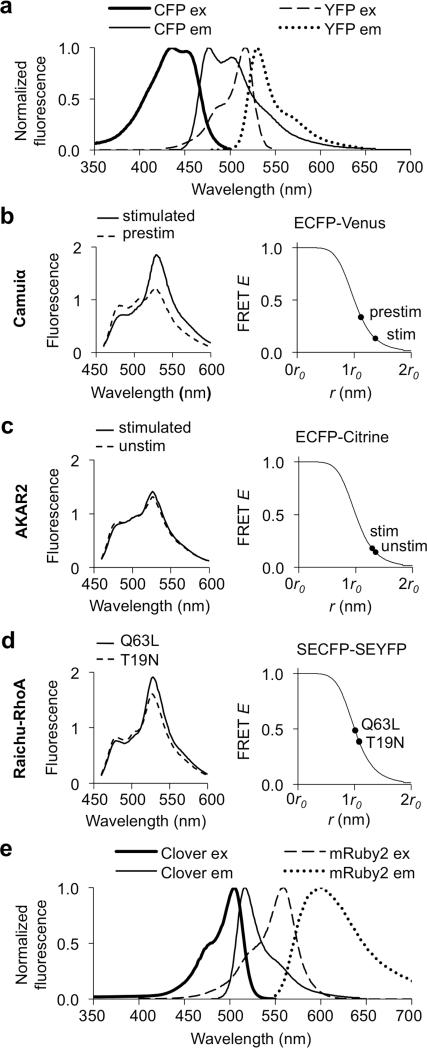
Figure 1.
Assessment of FRET reporter performance using Förster equations and emission spectra. (a) Normalized spectra of ECFP and EYFP. Variants of CFP and YFP have identical spectra. (b-d) Modeling of existing FRET reporter performance using Förster equations and emission spectra. Ranges for the FRET efficiency E were derived by fitting theoretical to experimentally-obtained emission curves (left) and were then mapped to appropriate Förster E-r curves (right) for Camuiα (b), AKAR2 (c), or Raichu-RhoA (d). (e) Clover emission and mRuby2 excitation spectra show substantial overlap while Clover and mRuby2 emission spectra are better separated than CFP and YFP emission spectra.

