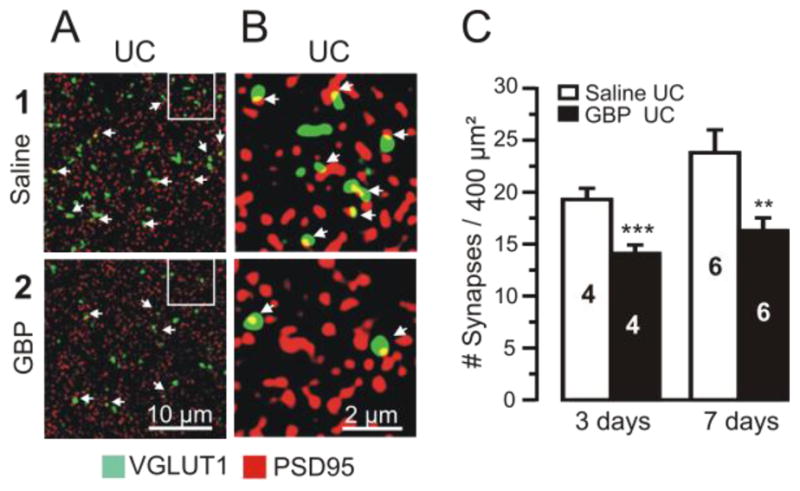
Figure 5. Chronic GBP treatment decreases posttraumatic synaptogenesis.

Confocal images of dual VGLUT1-IR (green) and PSD95-IR (red) from layer V of saline-treated (upper images) and GBP-treated rats (lower images).
A1–2: Images of UC sections from rats treated with saline (A1) and GBP (100 mg/kg/3x/d for 7d), (A2). Arrows in A–B point to sites of close apposition of VGLUT1- and PSD95-IR (yellow; presumed synapses).
B1–2: Images from marked segments of A1, A2 at 5x higher magnification. Calibrations in A2 for A1–2 and in B2 for B1–2.
C: Blinded counts of profiles of VGLUT1/ PSD95 colocalizations in UC cortical sections from UC rats treated with saline x3d (left graph, white bar) or GBP (100 mg/kg/3x/d x3d) (black bar). Right graph: 7d GBP treatment at same dose. Numbers in bars: number of animals. 2–3 sections analyzed/animal and 3 images from each section. Both GBP treatment durations resulted in a significant decrease in synaptic density compared to UC saline controls. ***: p < 0.001; **: p < 0.01). Data are expressed as mean ± SEM.
