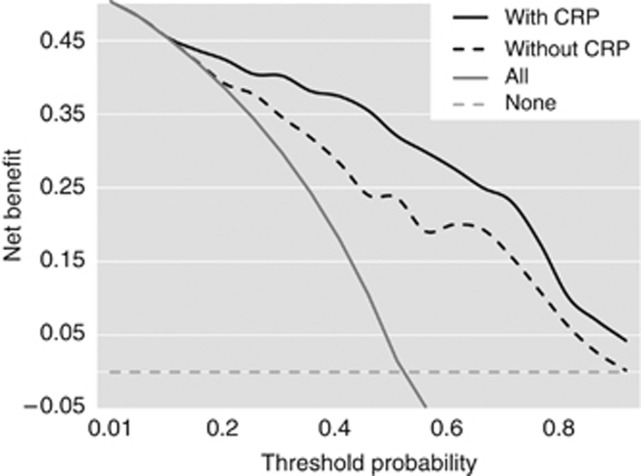
Figure 5.
Decision curve analyses for overall survival predictions. The dashed line indicates the net benefit of using the model without CRP, and the solid line indicates the net benefit of using the model with CRP. The assumptions that all patients will be alive and that no patients will be dead are represented by grey and black lines, respectively. Abbreviation: CRP=C-reactive protein.

