Figure 2.
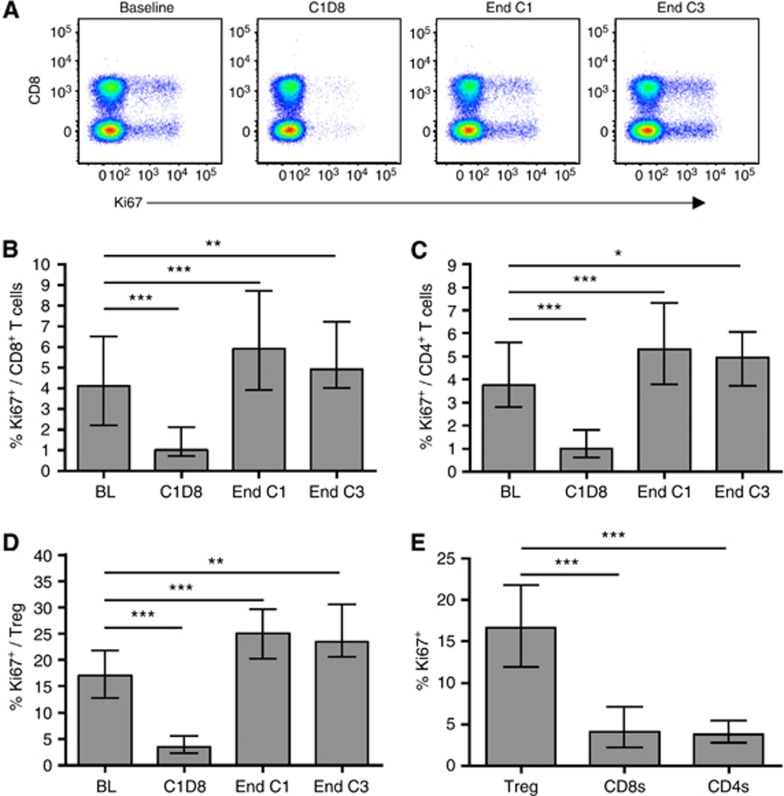
The effect of chemotherapy on T-cell proliferation. (A) Ki67 expression by CD8+ and CD8− (CD4+) T cells from a representative patient. Plots are gated on CD3+ lymphocytes. (B, C, D) Proportions of proliferating (Ki67+) CD8+ T cells (B), CD4+ T cells (C) and Treg (D) in all patients during chemotherapy. (E) Ki67 expression by Treg vs CD8+ T cells and total CD4+ T cells in all patients at baseline. Graphs show median and IQR. Time points were compared using a linear mixed model (B, C, D) and T-cell subsets using the Wilcoxon signed rank test (E). *P<0.05, **P<0.01, ***P<0.001.

