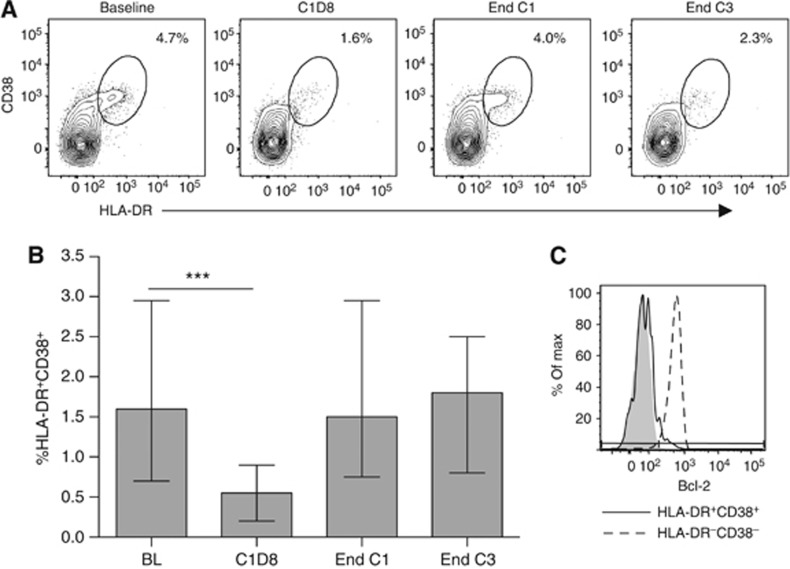
Figure 3.
The effect of chemotherapy on activated effector T cells. (A) HLA-DR+CD38+ effector CD8+ T cells from a representative patient, values shown are percentage of total CD8+ T cells. (B) The proportion of effector CD8+ T cells in all patients during chemotherapy. Graph shows median and interquartile range. Time points were compared using a linear mixed model; ***P<0.001. (C) Bcl-2 expression in HLA-DR+CD38+ effector CD8+ T cells (solid line) vs HLA-DR−CD38− naive CD8+ T cells (broken line). Shaded area represents the corresponding isotype control.

