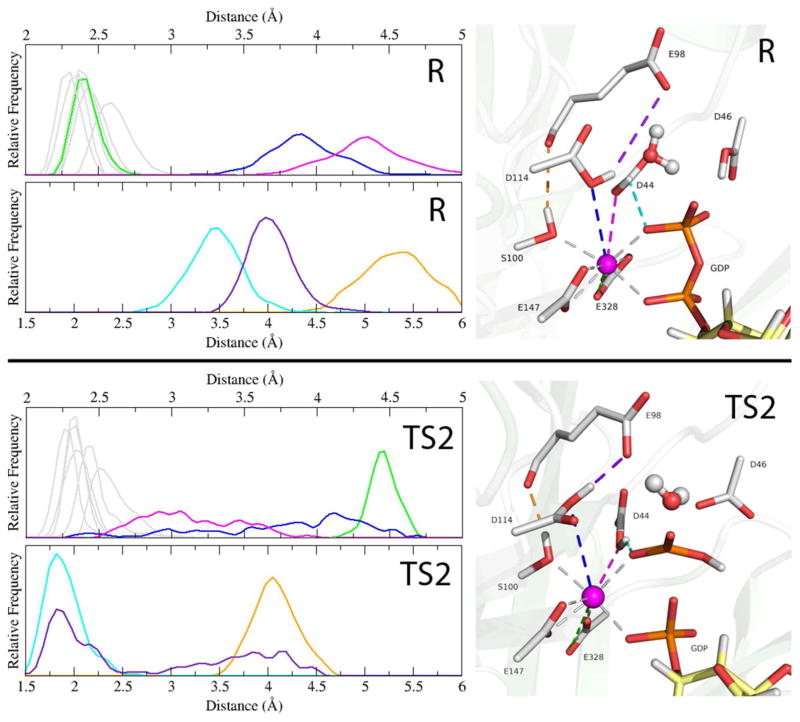
Figure 6.
Shown for the reactant state (R) and the rate determining transition state 2 (TS2) are histograms of the coordination distances around the catalytic calcium (upper plots) and 3 selected atom-atom distances (lower plots), all from the QM/MM-MD simulations. In the structural depictions on the right, the corresponding distances are shown as dashes and color coordinated to the histogram plots. Calcium-coordinated interactions that remain relatively constant from R to TS2 are greyed out. Highlighted is the flexibility of the calcium coordination as one of the E328 interactions (green) shifts out of the coordination shell as D44 (magenta) becomes more tightly coordinated in order to form a hydrogen bond with the transferring phosphate (cyan), and D114 is slightly more loosely coordinated (blue) as it forms a hydrogen bond with E98 (purple). These two new hydrogen bonds replace the nucleophile-coordinating interactions lost during the attack and stabilize the transition state. In orange is the TS2 stabilizing interaction between S100 and the carbonyl of E98.

