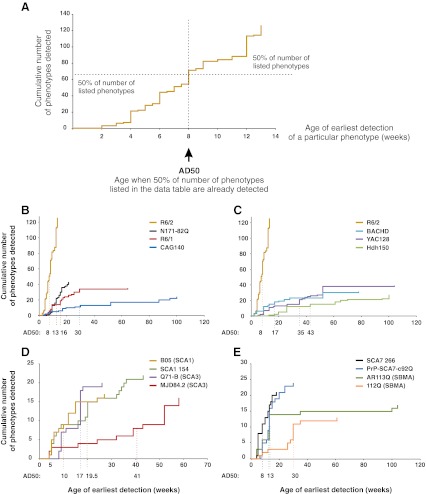
Fig. 5.
Graphs of disease progression in polyQ mouse models and the AD50 parameter. We have constructed a normalized value that describes the progression of the disease in a mouse model and that allows for comparison between mouse models. This is the AD50 (age at 50 % detected phenotypes), which represents the median of the values from the “age at earliest detection” column of the data table for an analyzed mouse model. The AD50 is the age at which 50 % of the total number of phenotypes for a particular mouse model has been detected and reflects the dynamics of disease progression in that model. The 50 % of number of phenotypes is a normalizing value for the different numbers of phenotypes described in various polyQ mouse models. a An example graph that shows how the graphs of disease progression are constructed for various models and where the AD50 is located on the graph for the models. b–e The graphs of progression of the disease for various models representing various polyQ diseases. The R6/2 contains 134 “detailed phenotypes” in the data table (after excluding polyQ aggregates and some phenotypes without an “age of earliest detection”). Thus, 50 % of the number of phenotypes equals 67 for the R6/2 model and 19 for the YAC128 model. The AD50 for the R6/2 model is 8 weeks and that for the YAC128 model is 35 weeks. Thus, the AD50 values reflect the different speed of disease progression in each model. The analysis excludes the “polyQ protein aggregates” phenotypes for reasons that are described in the main text

