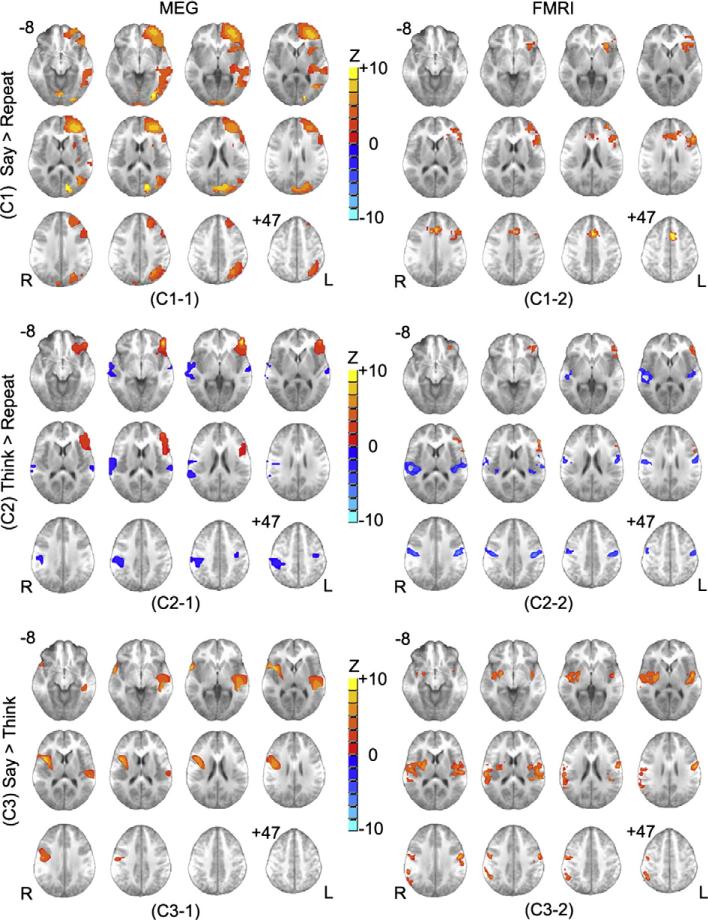
Fig. 2.
Group composite activation maps of three contrasts from MEG (left) and fMRI (right) results (N=16): (C1) Say > Repeat (covert generation versus overt repetition); (C2) Think > Repeat (overt generation versus overt repetition); (C3) Say > Think (overt generation versus covert generation). Significant level for all contrasts: p<0.05 corrected. Cluster size > 15. Slice range: Z=–8 to +47 mm (Talairach coordinates) and 5 mm between each successive slice displayed. All images are in radiologic orientation.

