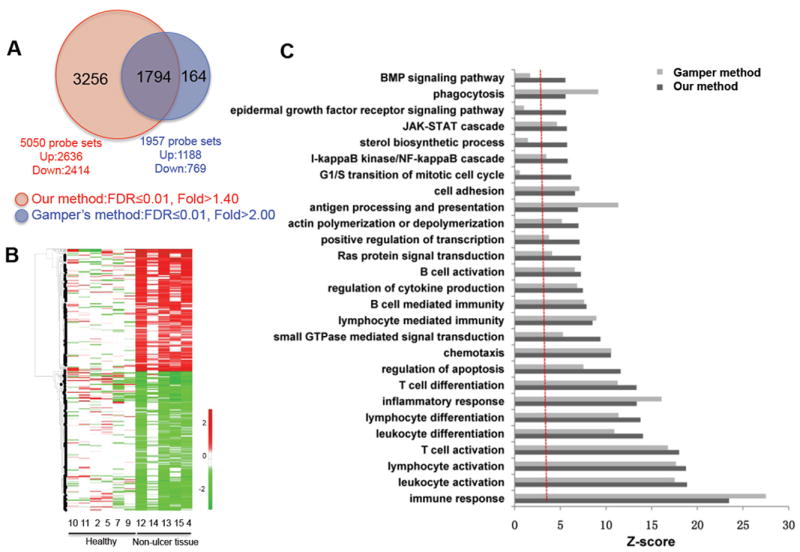
FIG. 1.

Comparison of differentially expressed genes (DEGs) of non-ulcerative tissue from patients with ulcerative interstitial cystitis (IC) vs bladder tissue from healthy controls obtained using the methods described in the present study, as well as those of Gamper et al. [14]. A, Venn diagram showing the relationships between DEGs generated using the methods described in the present study, as well as those of Gamper et al. [14]. B, Heatmap showing differential expression of the 3256 DEGs additionally identified using the methods described in the present study. The red and green colours represent the increase and the decrease of their expression levels in non-ulcerative tissue from patients with ulcerative IC compared to tissue from healthy controls, respectively. C, Functional enrichment analyses of DEGs generated using both methods. Most processes shown were commonly enriched by both DEG sets, whereas bone morphogenetic protein (BMP) and epidermal growth factor (EGF) receptor signalling pathways, sterol biosynthetic process, and G1/S transition of the mitotic cell cycle were all uniquely enriched in the DEG set of the present study. FDR, false discovery rate.
