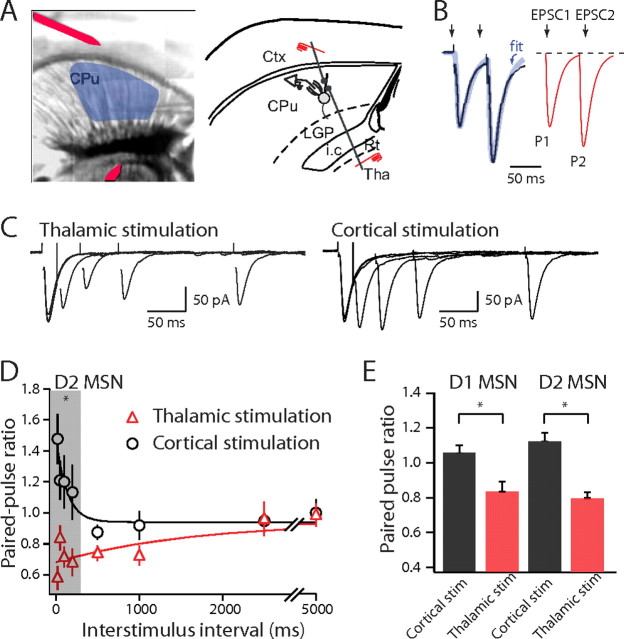
Figure 1.
Corticostriatal and thalamostriatal synapses have different PPRs. A, Composite image of a horizontal slice and horizontal diagram of mouse brain. Medium spiny neurons are sampled from the shaded region. Stimulating electrodes in the cortex (Ctx) and thalamus (Tha) are highlighted with a red overlay. B, To determine EPSC amplitudes in paired-pulse paradigms, the first EPSC was fitted with an exponential function and the amplitude of the second EPSC was measured from this baseline to the peak. C, EPSCs elicited by paired stimuli with increasing ISIs. EPSCs were recorded from the same cell with stimulation electrodes placed in the thalamus (left) and the cortex (right). D, Summary graph of PPRs recorded from striatopallidal neurons plotted against interstimulus interval for cortical (circles) and thalamic stimulation (triangles). E, Summary graph of PPRs recorded from striatonigral and striatopallidal neurons with a 50 ms ISI. LGP, Lateral globis pallidus; i.c., internal capsule; CPu, striatum; Rt, Reticular thalamic nucleus. Error bars indicate SEM. Asterisks indicate statistical significance.

