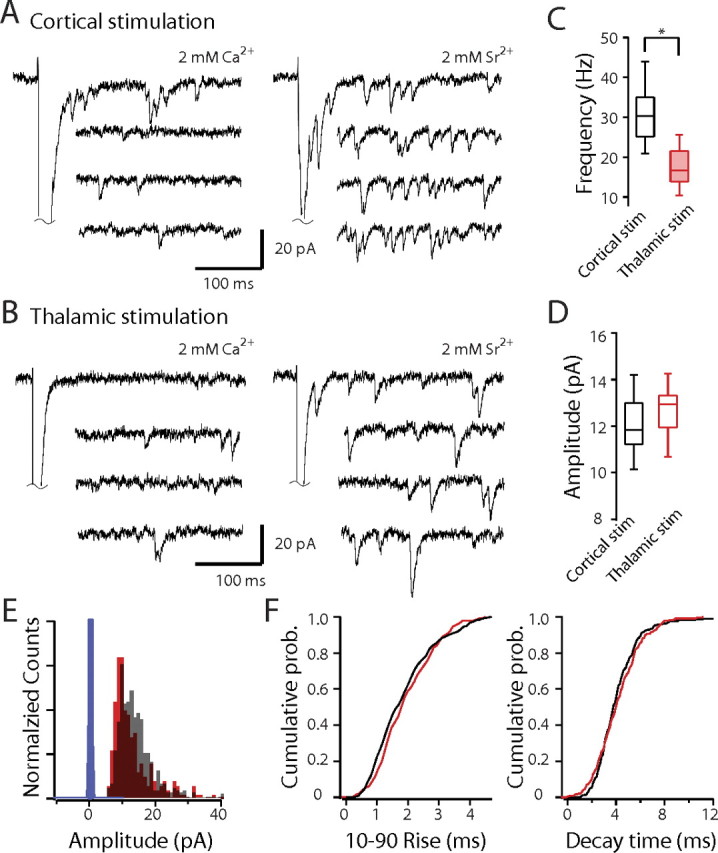
Figure 5.

Sr2+-induced asynchronous release differs at corticostriatal and thalamostriatal synapses. A, B, Sample traces of EPSCs evoked by cortical (A) and thalamic (B) stimulation in the presence of 2 mm Ca2+ or 2 mm Sr2+/0 Ca2+. C, Box-plot summary of asynchronous release frequency. D, Box-plot summary showing no difference in qEPSC size at corticostriatal and thalamostriatal synapses. E, Amplitude histogram of AMPAR qEPSCs in 2 mm Sr2+/0 Ca2+ solution evoked by cortical and thalamic stimulation. F, Cumulative 10–90% rise and decay time distributions of AMPAR qEPSCs in 2 mm Sr2+/0 Ca2+ solution by cortical and thalamic stimulation. Black, Cortical stimulation; red, thalamic stimulation.The asterisk indicates statistical significance.The blue bars are the distribution of baseline amplitudes.
