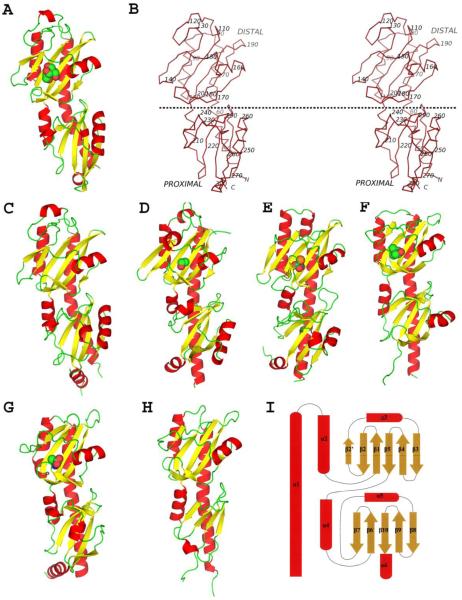
Figure 2.
Overall structures of Family sensor proteins. (A) Ribbon diagram of Z2-bis. (B) Stereo plot of a Cα trace of Z2. Every tenth C position is labeled. A dotted horizontal line, hypothetically parallel to the membrane surface, separates the distal and proximal domains. (C, D, E, F, G and H) Ribbon diagrams of Z3, Z6, Z8-PO4, Z16, McpX24 and KinD22, respectively. Ligands are shown in spacie-filling models for (A, D, E, F and G) where ligands were modeled into the structures. (I) Topology diagram of the Family 1 double-PDC sensor proteins. The figures were generated using PyMol67.

