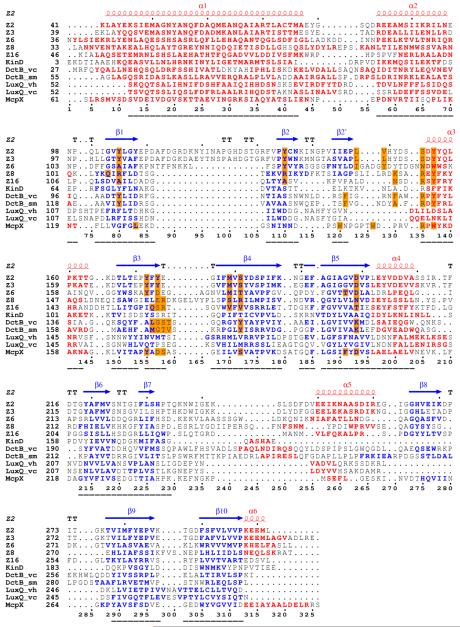
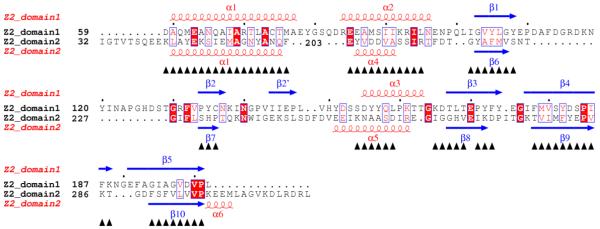
Figure 3.
Structure-based sequence alignments. (A) Alignment of double-PDC sensor domains. Secondary structure elements are specified at the top of the alignment based on the DSSP calculation for Z2. Sequences are shown for the sensor domains of Z2, Z3, Z6, Z8, Z16, KinD, vcDctB, smDctB, McpX, vhLuxQ and vcLuxQ with starting residue numbers given on each line. Helix residues are shown in red and strand residues are shown in blue. Ligand binding site residues are identified by orange-filled boxes. Numbers at the bottom specify positions used in comparisons. Sequence-aligned core residues used for RMSD calculations (Table 4) are identified by underlining. (B) Alignment of the two domains of Z2. Starting residue numbers are shown for each sequence segment. Superposed residues are identified by black triangles at the bottom. Identical residues are identified by red boxes and similar residues are identified by empty boxes. The pictures are made using ESPript68, 69, 70.


