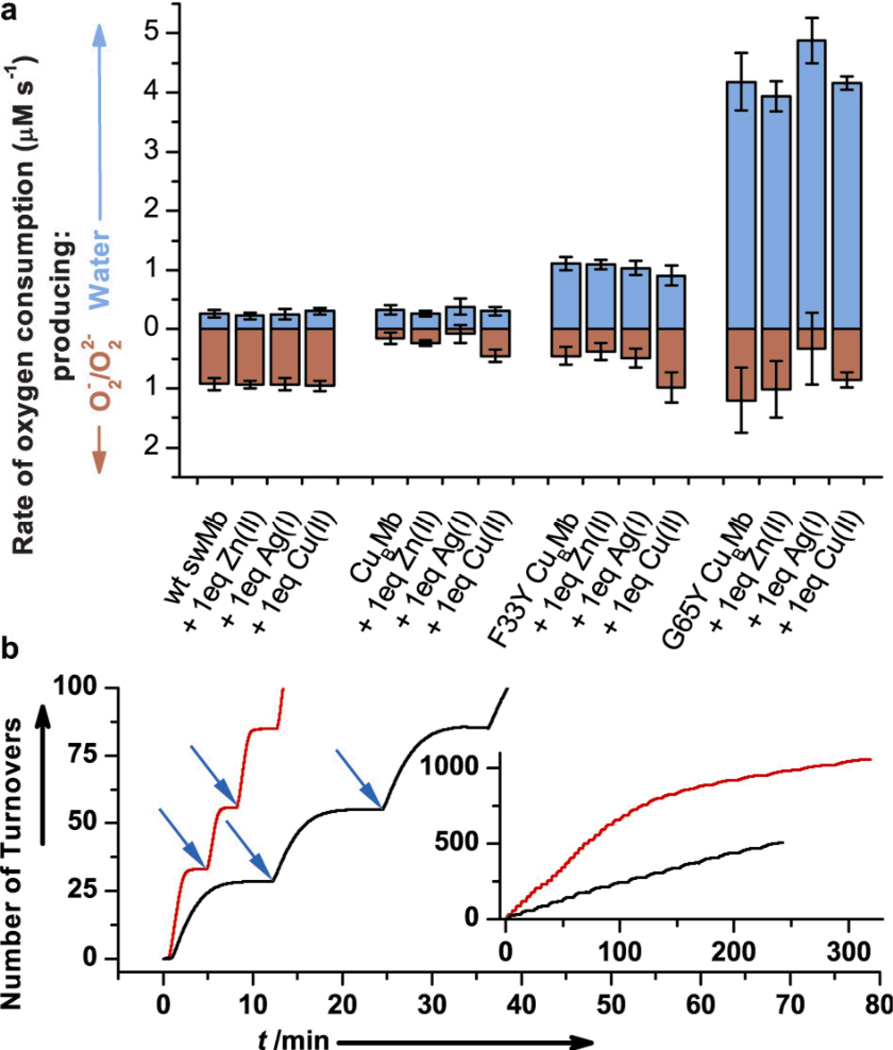
Figure 3.
Characterization of the O2 reduction; a) Rates of oxygen reduction to form either water (blue) or superoxide/peroxide (red) with 18 µM WTswMb, CuBMb, F33Y-CuBMb or G65Y-CuBMb; b) Number of turnovers of O2 reduction by E-F33Y-CuBMb (black) and E-G65Y-CuBMb (red); blue arrow indicates addition of ~28 equivalents O2. Inset, region of high number of turnovers.

