
Figure 3.
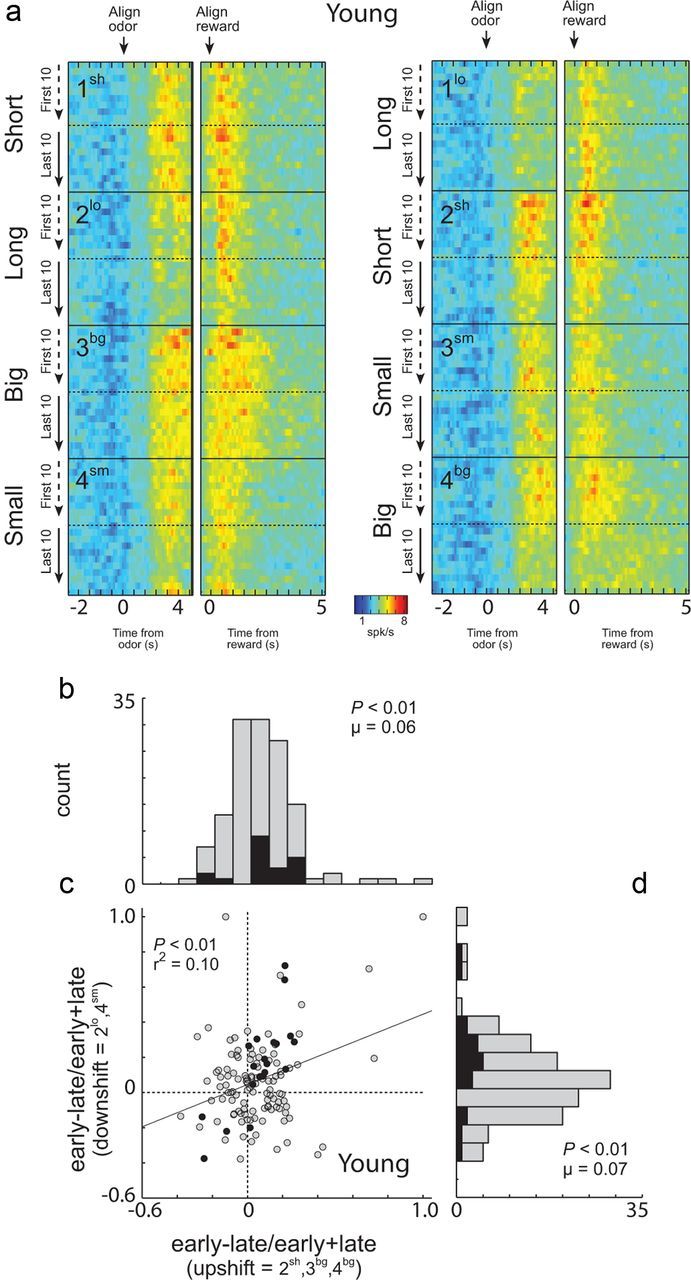
Neural activity in ABL of young animals was increased in response to unexpected reward delivery and omission. a, Heat plots showing average activity over all ABL neurons from young animals (n = 131) that showed a significant effect of delay or size in the ANOVA during the 1 s after reward delivery. Activity over the course of the trials is plotted during the first and last 20 (10 per direction) trials in each training block (Fig. 1a; blocks 1–4). Activity is shown, aligned on odor onset (“align odor”) and reward delivery (“align reward”). Blocks 1–4 are shown in the order performed (top to bottom). Thus, during block 1, rats responded after a “long ” delay or a “short ” delay to receive reward (actual starting direction—left/right—was counterbalanced in each block and is collapsed here). In block 2, the locations of the short delay and long delay were reversed. In blocks 3 and 4, delays were held constant, but the size of the reward (“big ” or “small”) varied. Line display between heat plots shows the rats' behavior on free-choice trials that were interleaved within the forced-choice trials. Value of 50% means that rats responded the same to both wells. b–d, Distribution of indices representing the difference in firing in individual neurons to reward delivery (b) or reward omission (d) early versus late in the relevant trial blocks. Correlation between indices shown in b and d is shown in c. Filled bars (b, d) and dots (c) indicate the values of neurons that showed a significant main effect (p < 0.05) of learning (early vs late) with no interaction in the two-factor ANOVA described in the text.