
Figure 3.

Effect sizes of BMI loci for European Americans in the Add Health adolescent cohort compared with the findings in adults. Z-test used to compare effect sizes of Add Health adolescents and ARIC adults: 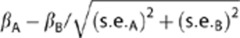 . Of 41 comparisons, the SNPs displayed are those with P-value for differences <0.10, sorted from largest to smallest effect estimates in Add Health adolescents. *P<0.05 for difference, †P<0.1 for difference.