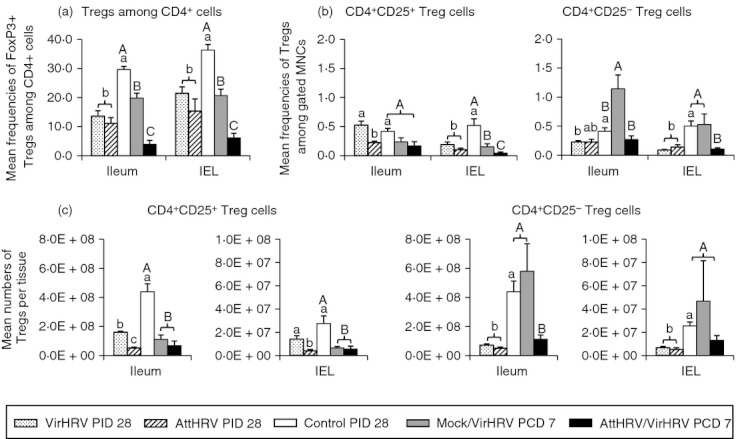
Figure 2.

Frequencies of FoxP3+ regulatory T (Treg) cells among CD4+ cells (a), CD4+ CD25+ and CD4+ CD25− Treg cells among mononuclear cells (MNC) (b), and numbers of CD4+ CD25+ and CD4+ CD25− Treg cells per tissue (c) in intestinal lymphoid tissues of gnotobiotic (Gn) pigs. The graph in panel a shows the frequencies of FoxP3+ cells among CD4+ cells. The two graphs in panel b show the frequencies of CD4+ CD25+ and CD4+ CD25− Treg cells, respectively. The two graphs in panel c show the absolute numbers of CD4+ CD25+ and CD4+ CD25− Treg cells per tissue, respectively. Data are presented as mean frequency or number ± SEM (n = 3 to n = 6). Different lowercase letters above bars indicate significant differences in frequencies compared among virulent human rotavirus (VirHRV) infection, attenuated human rotavirus (AttHRV) inoculation and control groups at PID 28 for the same cell type and tissue (Kruskal–Wallis test, P < 0·05); different capital letters above bars indicate significant differences in frequencies compared among Mock/VirHRV, AttHRV/VirHRV groups at post-challenge day (PCD) 7 and the control group at post-inoculation day (PID) 28 for the same cell type and tissue (Kruskal–Wallis test, P < 0·05), whereas shared letters indicate no significant difference.
