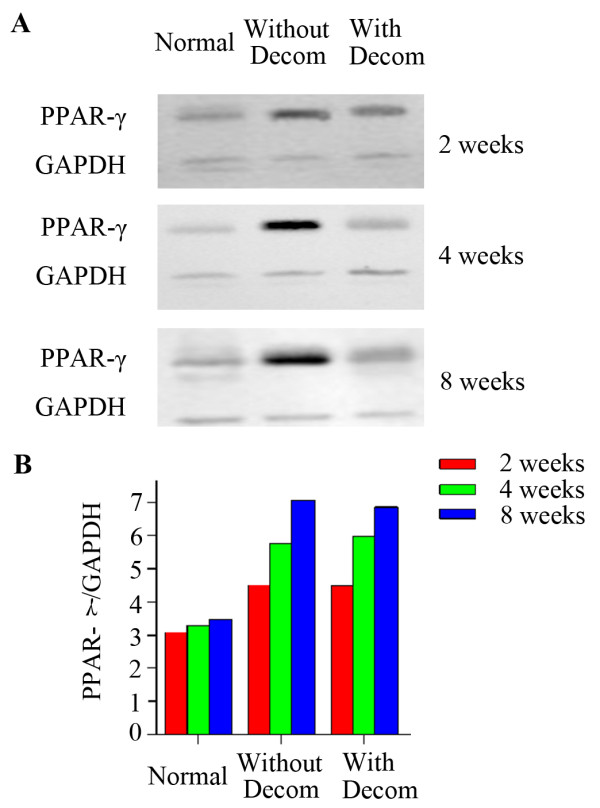
Figure 2.

PPAR-γ protein expression in the femoral head tissue by western blot analysis. (A) Western blot showed the expression levels of PPAR-γ protein in the femoral head bone tissues in the normal control animals and experimental animals with or without decompression at each 2, 4 and 8 week time point; (B) Western blot results of PPAR-γ expression in the femoral head was indicated by the ratio of band intensity of PPAR-γ with GAPDH.
