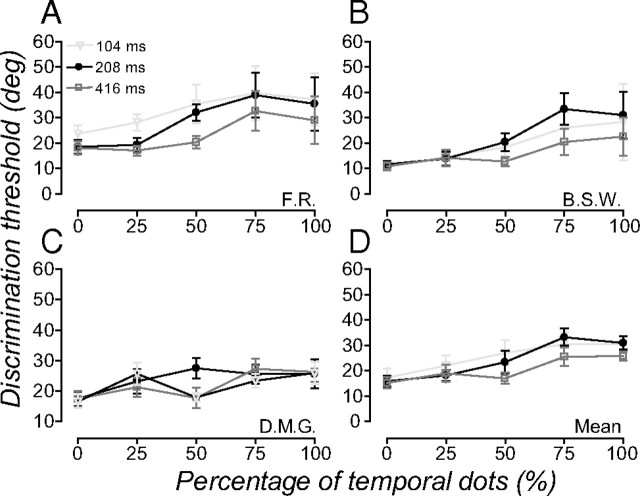
Figure 7.
Direction discrimination thresholds in the spatiotemporal pooling experiment. A–C, Symbols show the direction discrimination thresholds of three observers at three stimulus durations, plotted as a function of the percentage of temporal dots in the comparison. D, Symbols show the average direction discrimination thresholds of observers plotted and notated as in A–C. Error bars are 95% CIs.

