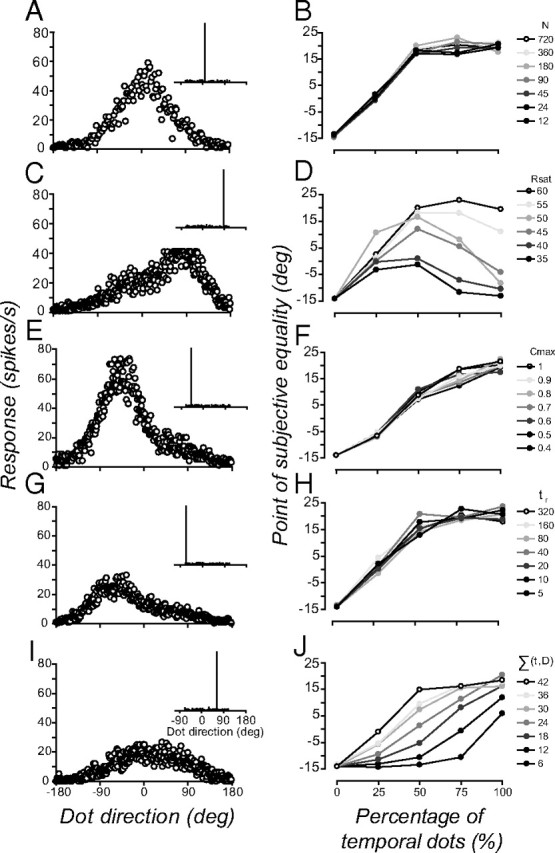
Figure 8.

Effects of manipulating the behavior of input neurons on the estimate of the maximum likelihood perceived direction in the spatiotemporal pooling experiment. Left column shows basic model population responses to equally balanced (50%, 50%) spatial and temporal samples from a comparison distribution (inset in each panel), presented for a total duration of 104 ms. The left column shows examples of changes to the shape of the population response caused by varying the following: A, numbers of neurons in the population (N = 180 neurons); C, level at which the responses of the neurons saturate (Eq. 7, Rsat = 40 spikes/s); E, correlation structure of the interal noise across the population of neurons (Eq. 10, Cmax = 0.5); G, time constant of temporal response integration (Eq. 8, τr = 20 ms); and I, rate at which neurons respond to the number of dot directions on their receptive fields [Eq. 9, Σ(t,D) = 18]. Right column shows how varying the model parameters N, Rsat, Cmax, τr, and Σ(t,D) modulated the estimate of the maximum likelihood of perceived direction in the spatiotemporal experiment. Varying the rate at which neurons respond to the total number of dots on their receptive field was the only manipulation to the basic model that approximated observers' performance at different stimulus durations.
