Figure 1.
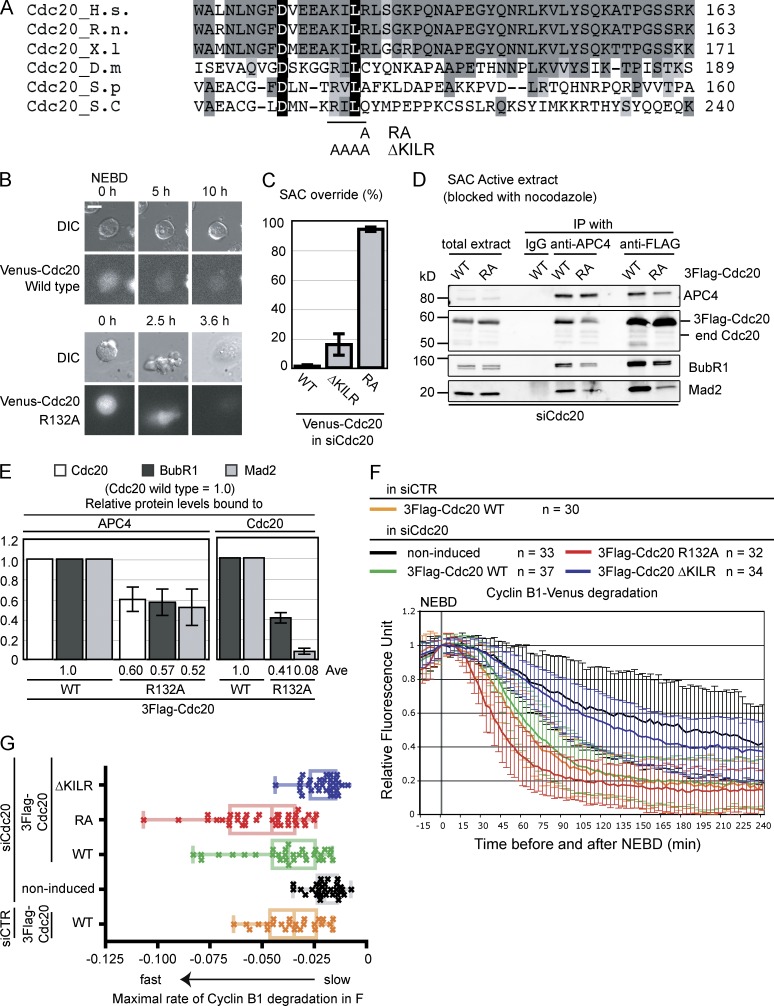
The Mad2 binding motif is required for Cdc20 activity. (A) Alignment of the Mad2 binding motif in Cdc20 from different organisms. Black shows residues present in all species; dark gray shows residues present in three or more species; gray shows similar residues. The R132A and ΔKILR mutations (129KILR132 is substituted by four alanines) are also shown. H.s., Homo sapiens; R.n., Rattus norvegicus; X.l, Xenopus; D.m, Drosophila melanogaster; S.p, Schizosaccharomyces pombe; S.c, Saccharomyces cerevisiae. (B and C) The RA, but not the KILR mutant, overrides the SAC. Plasmids expressing siRNA-resistant Venus-tagged wild type, RA, or ΔKILR mutant of Cdc20 were transfected into HeLa cells with siRNA against human Cdc20. Cells were analyzed by time-lapse differential interference contrast (DIC) and fluorescence microscopy at 10-min intervals in the presence of 100 ng/ml nocodazole. (B) Representative images of cells. Bar, 10 µM. (C) Percentage of cells exiting from mitosis within 10 h. 100 cells were analyzed in each from three independent experiments. (D and E) The Cdc20R132A mutant partially forms the MCC but weakly binds Mad2. (D) HeLa cell lines expressing inducible 3×Flag-Cdc20, wild type, or RA mutant were treated with siRNA against Cdc20, arrested in prometaphase with 0.33 µM nocodazole + 10 µM MG132, and harvested by mitotic shake off. The APC/C or 3×Flag-Cdc20 was immunoprecipitated and analyzed by quantitative immunoblotting with the indicated antibodies. (E) Means of the relative amounts of indicated proteins in APC4 or 3×Flag-Cdc20 immunoprecipitates calculated from three independent experiments with the amount of protein bound to wild-type Cdc20 set to 1. Means are shown on the bottom. (F and G) The ΔKILR mutant cannot substitute for wild-type Cdc20. (F) Cdc20 was depleted by siRNA in cells expressing wild type, R132A, or ΔKILR mutants of Cdc20 from an inducible promoter, and ectopically expressed Cyclin B1–Venus was analyzed by time-lapse DIC and fluorescence microscopy. As controls, noninduced cells were treated with siRNA against Cdc20, and cells expressing wild-type Cdc20 were treated with siRNA against GAPDH (siCTR). The fluorescence of individual cells was measured, the value at NEBD was set to 1, and the means ± SD for all cells were plotted. Cyclin B1 destruction in Cdc20-depleted and noninduced cells, in cells induced for wild-type Cdc20, the RA, the ΔKILR mutants, or in cells expressing wild-type Cdc20 and treated with control siRNA are plotted on the same graph. n = number of cells analyzed in two independent experiments. (G) The rate of Cyclin B1 destruction is plotted as a box and whisker chart. The maximal rate of cyclin degradation was obtained from the data in F by nonlinear regression analysis assuming a sigmoidal dose–response (variable slope). The center lines are the medians, boxes correspond to the range between 25 and 75% of all the data, and the whiskers correspond to the minimum and maximum of all the data. Means and SDs were calculated from three independent experiments. Ave, average; end, endogenous; WT, wild type.

