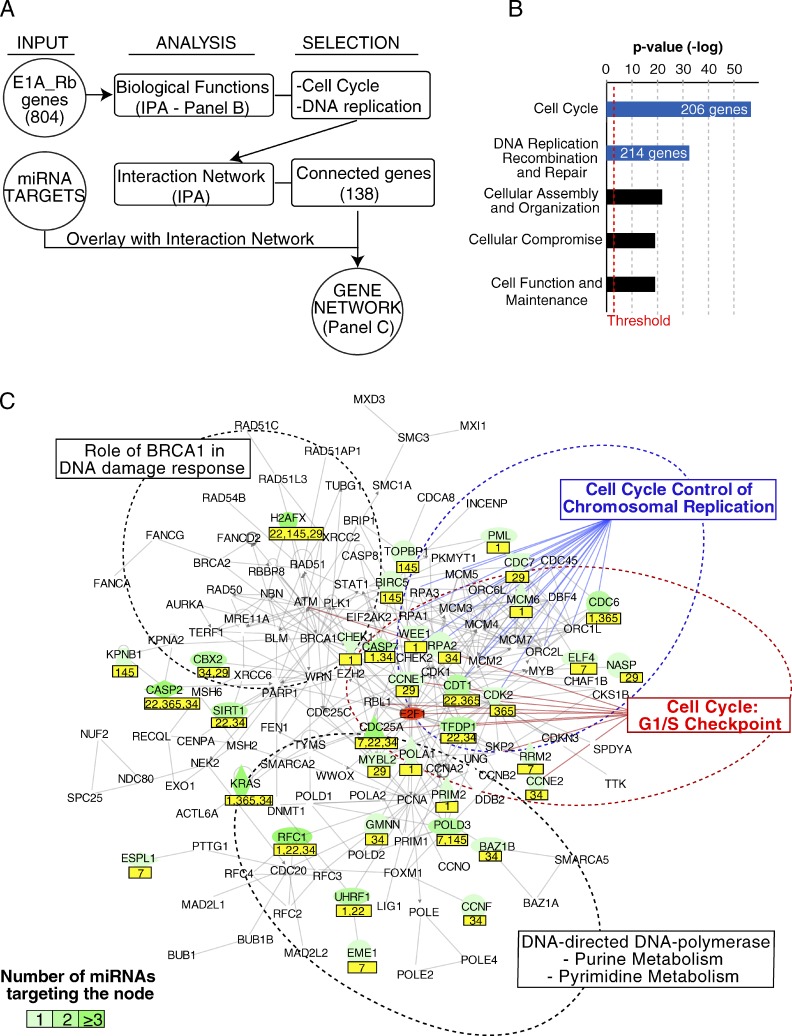
Figure 7.
Network of miR targets. (A) The scheme summarizes the steps that were followed to generate a network of DA-7–targeted genes involved in the control of proliferation and DNA replication. (B) The bar graph shows the most enriched biological functions as assessed through Ingenuity systems pathway analysis software. The list of E1A_Rb–induced genes (804) was used as input. A red line marks the threshold for significance. (C) The gene network of 138 proteins (from the two most enriched biological functions as determined in B) and their connections (gray lines) is depicted. On top of this map, miR targets are displayed in green. miRNA names are reported in a yellow box below the node. A dotted line marks areas with nodes belonging to canonical pathways.

