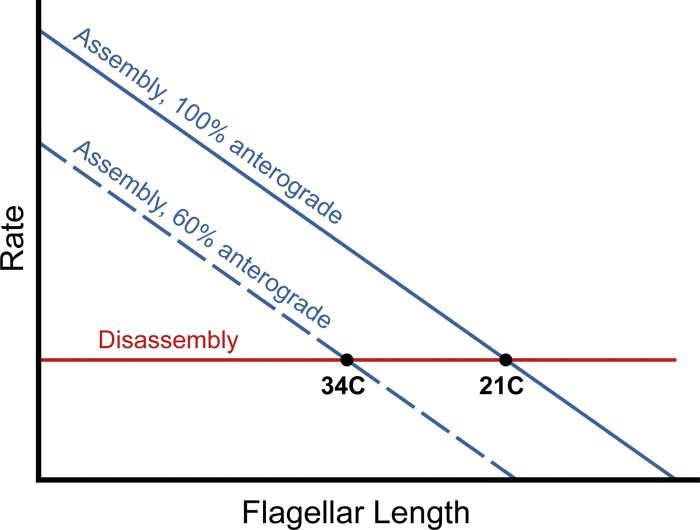
Figure 8.
Comparison of the dhc1b-3 phenotype with the current balance-point model of flagellar length control. The horizontal red line represents the length-independent disassembly rate and the blue lines are length-dependent assembly rates at 21°C (solid line) and 34°C (hashed line, 40% reduction in anterograde IFT frequency). The balance-point model predicts that both existing and assembling dhc1b-3 flagella should approach the same steady-state length (points indicated by “21C” and “34C”), where the assembly and disassembly rates are equal.

