Figure 3.
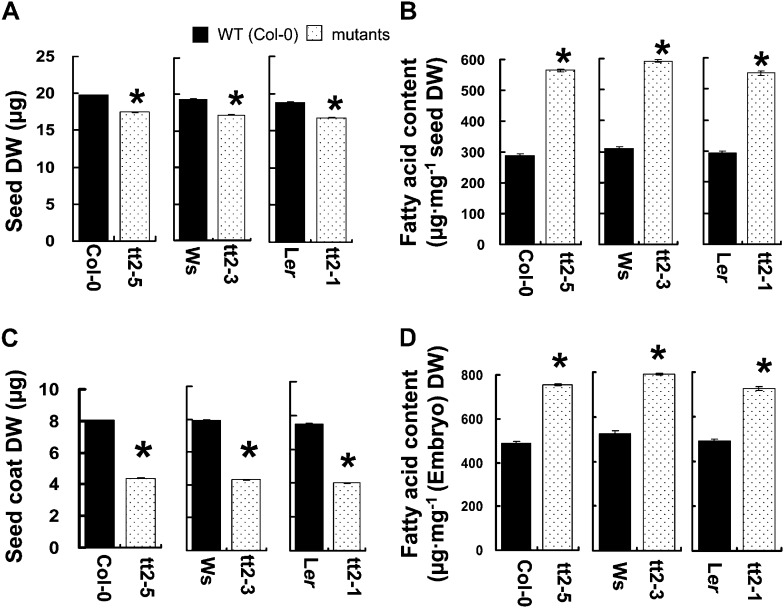
Comparison between the tt2 mutant lines and their respective wild types. A, Seed DW. B, FA content. C, Seed coat DW (including endosperm). D, FA of embryo. Data presented are mean values of three independent experiments (three biological repeats) ± se. The asterisks (*) indicate significant difference (P ≤ 0.05) compared with the wild type.

