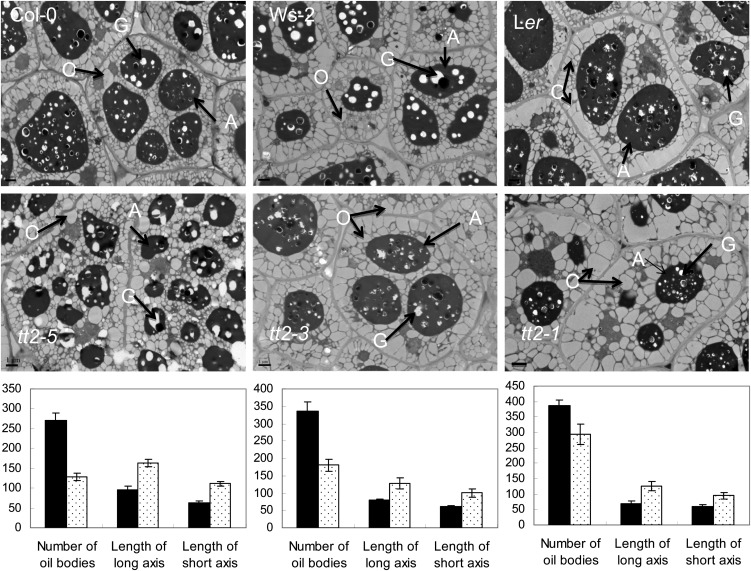
Figure 4.
Comparison of the number and size of oil bodies in mature seed cells between the wild type and tt2 mutant lines in pairs. Arrows in TEM images point to oil bodies (O), aleurone grains (A), and globoids (G). Bar = 1 μm. The quantitative data are shown in a graph under each pair of mutant and wild type. The number of oil bodies are mean value of 120 cells from six seeds. The length of long axis and short axis were calculated based on all oil bodies that were contained in 120 cells. The y axis of the graphs stands for numbers as well as 1% μm.

