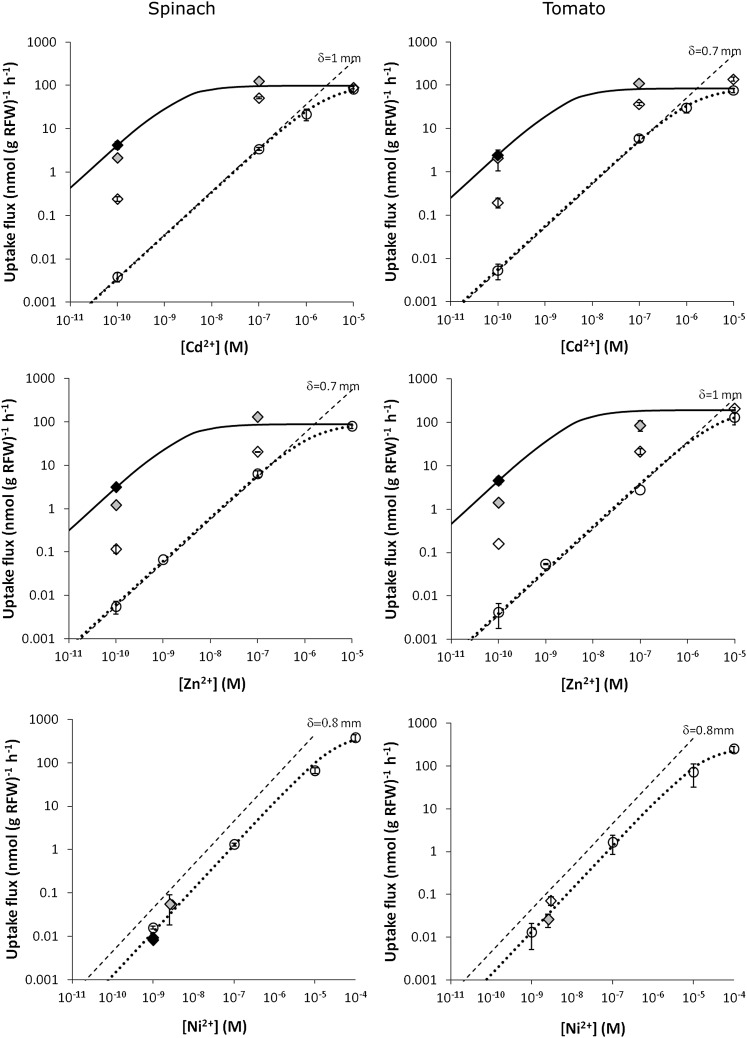
Figure 2.
Short-term (4-h) uptake flux of Cd, Zn, and Ni by spinach (left) or tomato (right) as a function of the free ion concentration in solution for solutions without complexes (circles) or in solutions with complexes (diamonds). The complex to free ion concentration ratio was 100 (white symbols), 104 (gray), or 105 (black) for Cd and Zn, or approximately 30 (white), 40 (gray), or 100 (black) for Ni. The dashed line show the maximal diffusion flux for a diffusive layer thickness δ as indicated in the figures (fitted to correspond to the uptake in unbuffered solutions at low concentrations). The dotted line gives Michaelis-Menten curve fitted to the uptake in unbuffered solutions. The full line gives the Michaelis-Menten curve for Cd and Zn fitted to the uptake in the most strongly buffered solution where uptake was likely internalization limited. Error bars indicate ses of two replicates. The parameters of the fitted Michaelis-Menten curves are listed in Table II.

