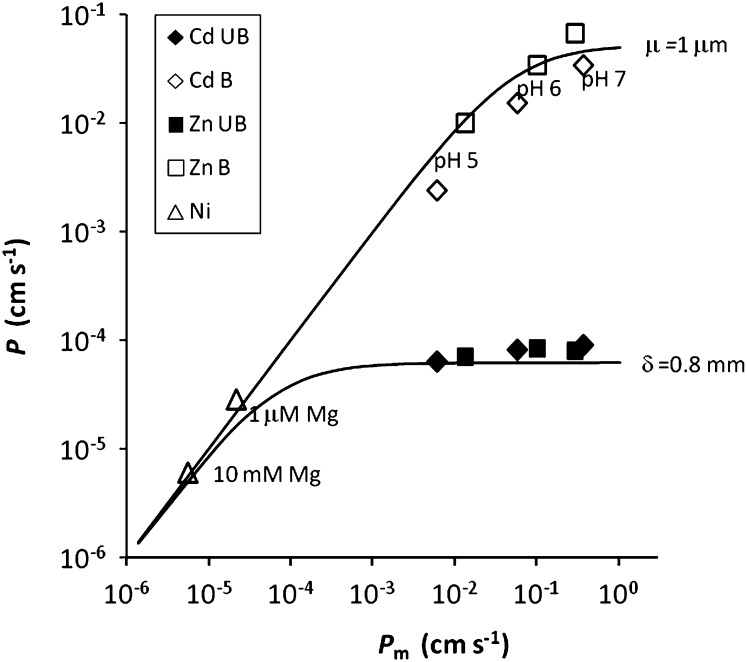
Figure 6.
Theoretical curves relating the apparent measured permeability P to the membrane permeability Pm (adapted from Smulders and Wright, 1971). The curves are shown for an unstirred, unbuffered solution (diffusive layer thickness δ of 0.8 mm) or for a very strongly buffered solution (reaction layer thickness μ of 1 μm). The symbols show measured permeability for spinach against estimated membrane permeability (using the best-fit model parameters; Table III) for Ni uptake at low or high Mg concentration and for Cd and Zn uptake at different pH values in unbuffered (black symbols) or strongly buffered solutions (white symbols).

