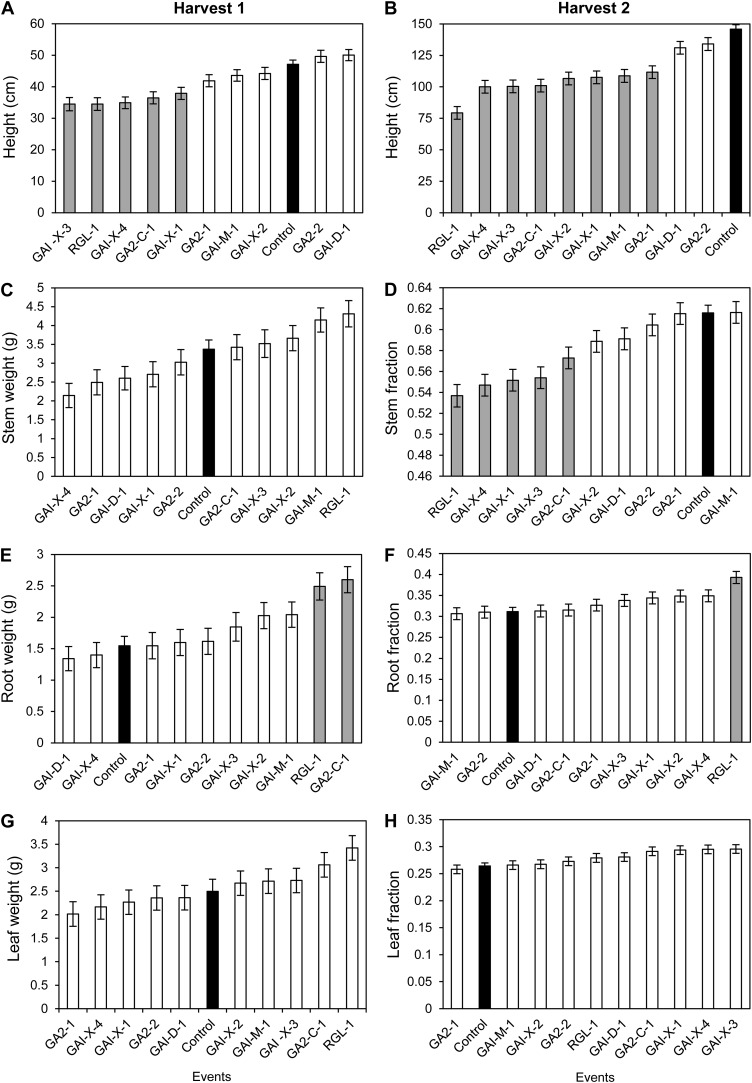
Figure 4.
Growth and allocation of biomass in the raised-bed study during early (harvest 1; A, C, E, and G) and later growth stages (harvest 2; B, D, F, and H); only results from statistically significant effects are shown. The bars represent means (least square) ± se. Supplemental Figure S1 shows dry weight and height allocation among roots, stems, and leaves. Black bars are controls; white bars are transgenic events; and gray bars are statistically significant (P < 0.05) events compared with controls.

