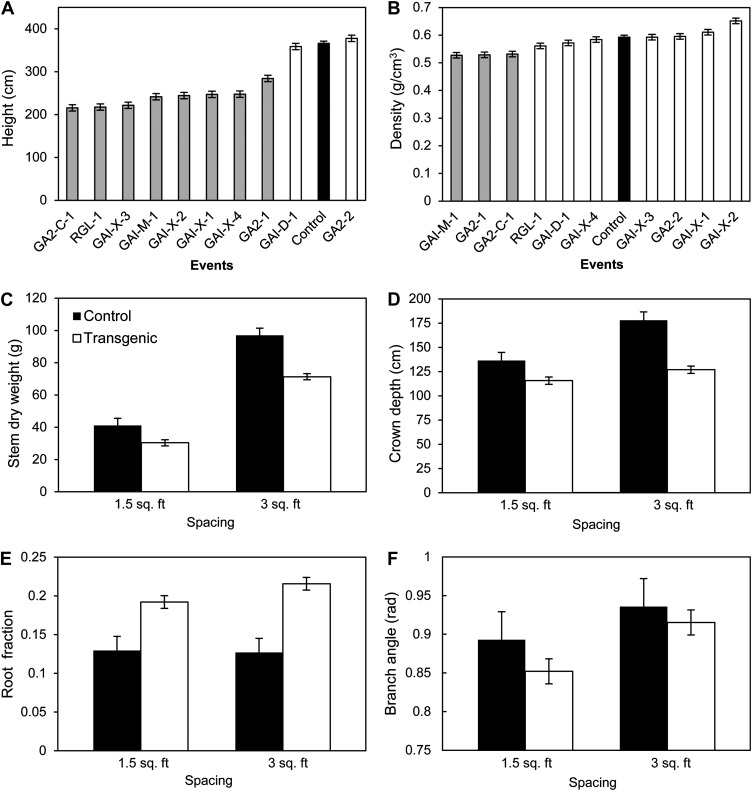
Figure 5.
Growth and allocation of biomass in relation to density in the high-density field study. Spacing is given in feet as per the original study (where 1.5 feet = 0.45 m, 3.0 feet = 0.91 m). The bars represent means (least square) ± se. A and B represents height and stem density, respectively, for all events, where black bars are controls; white bars are transgenic events; and gray bars are statistically significant (P < 0.05) events compared with controls. C to F represent the transgenic pool versus control for shoot dry weight, crown depth, root fraction, and branch angle, respectively. Supplemental Figure S2 presents dry weight partitioning among roots and stems and height differences between high- and low-density plantings.

