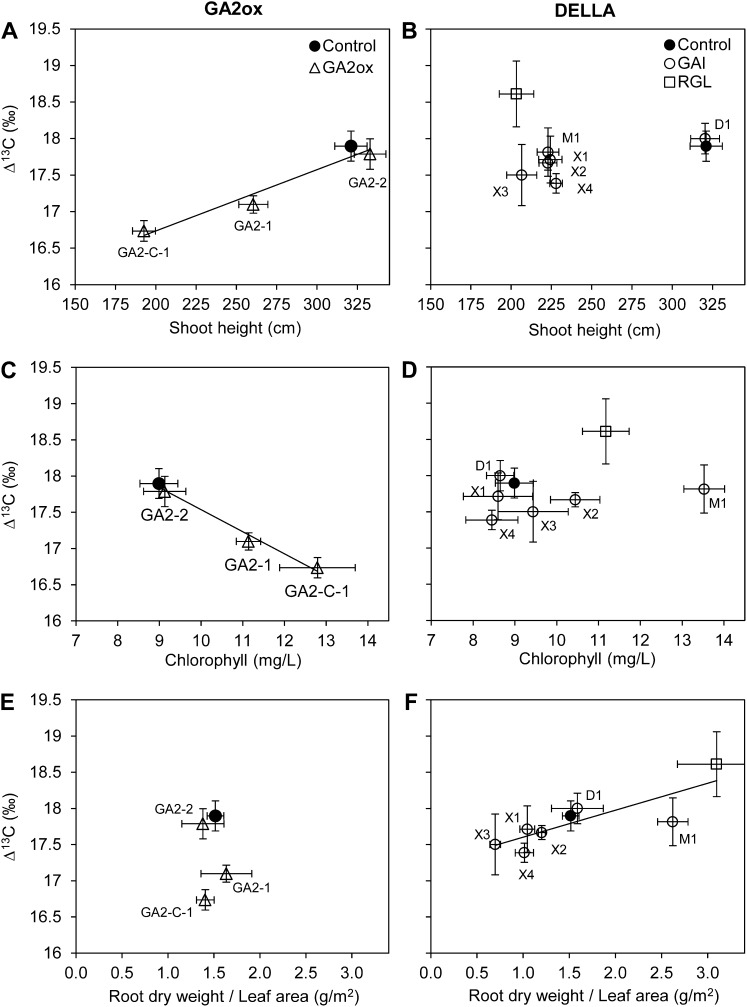
Figure 6.
Leaf carbon isotope discrimination values for transgenic, semidwarf poplars versus height (A and B), leaf chlorophyll concentration (C and D), and root dry weight-leaf area, an index of potential transpiration, based on ratios (E and F). The left panels display the GA2ox transgenics, and the right panels show the DELLA-type transgenics. For the GAI semidwarfs, the specific genotypes are abbreviated (i.e. X3 = GAI-X-3; right panels). Only the statistically significant linear regression lines are plotted: A, r2 = 0.95, P = 0.028; C, r2 = 0.96, P = 0.008; F, r2 = 0.68, P = 0.012.

