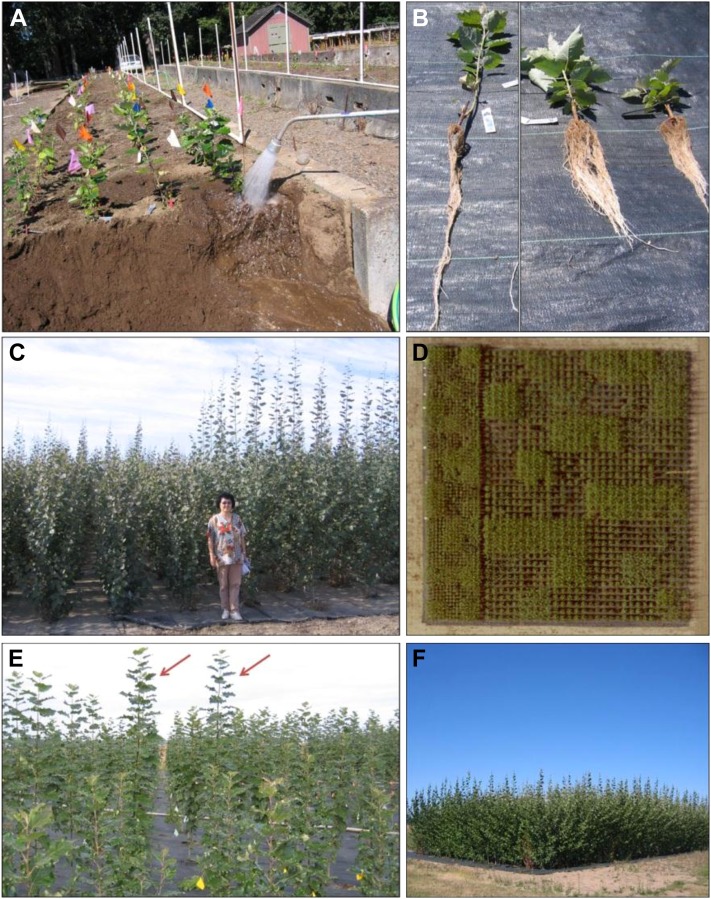
Figure 9.
Views of the field trials. A, Washing roots from plants harvested in the raised-bed study. B, View of plants harvested from raised beds; the left-most plant is a nontransgenic control, and the two plants on the right are from construct GAI-X-1. Note the more stocky and rooty morphology of the transgenics. C, Views of plants from the field study during second growing season (August), GA2-2 on the right and GAI-X-1 on the left. D, Aerial view of the field study showing the two densities and randomized 25-tree plots with differential growth. E and F, View of trees in the competition study during the first year of growth (E; arrows identify control trees approximately 2 m in height, surrounded by semidwarf transgenic trees) and plantation view during the second year of growth (F), where the tallest trees are approximately 5 m in height. [See online article for color version of this figure.]

