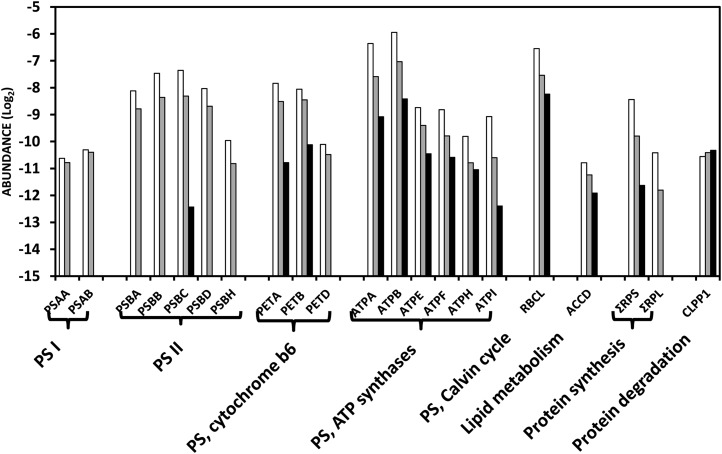
Figure 5.
Abundance of proteins encoded by the plastid genome. Proteins present at all three stages of plastid development (MG: white bars; B: gray bars; and R: black bars) were classified according the MapMan functional classes. Protein abundance is expressed as a log2. The graphs were generated using the data and symbols of Supplemental Table S2. PSA, PSB, PET, and ATP correspond to proteins of the subunits of PSI, PSII, cytochrome b6, and ATP synthase complexes, respectively. RBCL corresponds to the large subunit of Rubisco, ACCD to the D subunit of acetyl CoA carboxylase, and CLPP1 to the caseinolytic protease P1. ΣRPS and ΣRPL represent the sum of proteins of the small 30S and the large 50S subunits, respectively.

