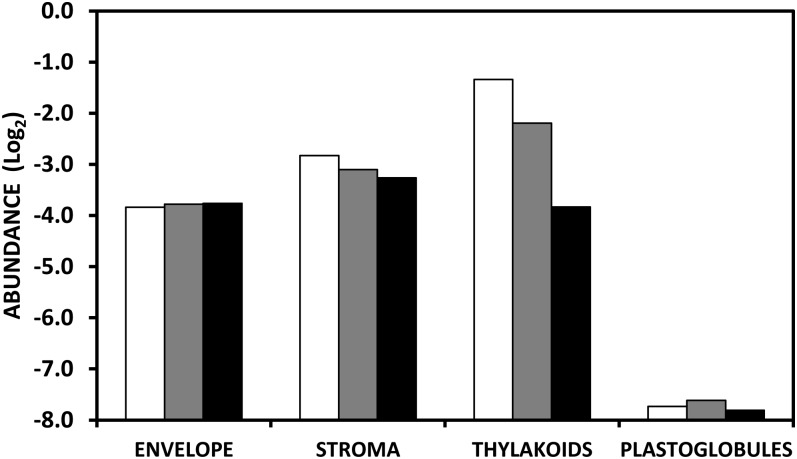
Figure 7.
Abundance of proteins in the subplastidial compartments of tomato fruit plastids. Plastids were isolated from MG (white bars), B (gray bars), and R (black bars) fruit. Protein abundance is expressed as a log2. The present graph corresponds to Supplemental Table S3 generated by screening the tomato plastid proteome on the base of AT homologs with the AT-CHLORO subplastidial database (Ferro et al., 2010) for stroma, thylakoids, and envelope proteins and in Lundquist et al. (2012) for plastoglobule proteins.

